Cycling All Of Boulder
Starting in February of this year I decided to ride my bike on every road in Boulder. Every neighborhood, every dead-end, and every circle. I didn't do very much detailed planning for this. I didn't try to optimize my routes to minimize distance. I figured that the worst case was that I rode my bike a bit extra, and that's fine by me. Even with perfect planning there are road configurations that require some duplication anyway, so I wasn't bothered by repeating segments more than once. Also, since this was always going to be a multi-day endeavour, I knew I would have to repeat some segments that brought me to neighborhoods starting from my home.

To be clear, I didn't ride every road completely, I had some rules:
- I didn't ride dangerous roads. There are a few very busy roads in Boulder that lack a safe place to ride; they don't even have a gutter bike lane. No one paid me to do this, and being super-ultra complete isn't worth the danger
- I didn't do alleys. I love a good alleyway, and when I'm dictator I will require them to be built everywhere, but I didn't ride them for this project
-
I limited myself to roads actually in the city of Boulder. There are unincorporated islands within the city of Boulder, and I didn't ride in those unless I used them to get to other roads. For example, there are a number of unincorporated islands pictured below and I didn't do some of these roads

-
There is some ambiguity about when a road is actually in Boulder and not. Some city boundaries run along roads as pictured below. City roads have blue and white signs, while county roads are given green and white signs. Some of these border roads have green signs, and some have blue. In general I would use the color of the street sign to guide me as to if it was a city or county road. As an aside, I ended up riding on the road below because I used it to get to a part of Boulder that is only accessible via county roads

-
If a street had a "Private road, no city maintenance" sign, I didn't ride on it. Some private streets have green signs, which I would skip. I made two exceptions: NCAR and NIST. These are (semi-)governmental entities and therefore aren't private. Both are contained in city limits, so I felt it was appropriate to ride on them. I probably ended up riding on private roads here and there, but if they had a blue sign and no "Private street" sign, I figured it was fine for me to use it
- Similarly, I didn't do parking lots and other obviously private roads, like the roads in the IBM campus
- Some roads are under construction, and are either inaccessible or a complete mess. I avoided these as necessary or prudent
- I only needed to ride on a road in at least one direction, including divided roads
- I didn't focus on bike paths, but if one helped me get where I was going, I used it
I enjoyed this project. I visited parts of Boulder I had never seen before. I started to connect disparate parts of Boulder by era of development and design commonalities. For example, some residential neighborhoods have dead-end circles with parking in the middle. I found this design in a few places scattered across the city. All the older parts of Boulder have alleys, but mid-century developments stopped using them, likely because developers wanted to save money. However, some of the newest developments in Boulder have brought them back, because they are useful and a good idea, which I think is excellent.
Again, the project was fun, but I'm looking forward to getting back to more normal riding, where I'm not constantly changing direction and checking my GPS map for where I need to go next.
Here are some statistics:
- It took me 18 rides total
- 37 hours and 17 minutes of riding time
- 887 KM of distance
- 7,300 meters of climbing
Here's an animation of my progress1. The date and time is shown in the bottom right corner. To get the full effect, you'll want to view it on YouTube, full screen the video, and switch to 4K resolution. You can adjust the playback speed to make the video run faster, if you like. There are a few hiccups in the animation where progress backtracks and repeats. It's not in the original file I uploaded to YouTube and I have no idea what's going on.
Finally, I've updated my cycling history map page to include all of this new data.
- I used GPX Animator ↩︎
My Cycling in 2025
It's time for some end of year recap posts, starting with my year in cycling 2025. A year ago I posted a recap of my year in cycling for 2024 which covered a wide range of topics including a short history of my bikes, cyclo-computers, and overall trends over two decades. This year's update is much more brief: I've updated the plots I made a year ago with another column for 2025. Here are some highlights:
- I went on 164 rides, which is 31 more times than I ever have previously1. To put this in perspective, in 2018 I rode my bike only 22 times total
- My total distance of 6,735 KM and time of 277 hours is second only to 2011, which was pre-children. This even bested two years (2006, 2007) when I was still a graduate student and was actively participating in races
- I climbed over 80,000 meters, which is my most ever2
- I climbed 3.5% more meters per KM than last year, but my average speed was basically the same, which I think is cool
I don't know if I can practically beat some of the maxes above unless I make some life changes, such as moving somewhere without four seasons, or convincing someone to pay me to ride my bike (which in all honesty, no one should). Overall, I feel pretty great about my cycling in 2025, and my goal for 2026 is to achieve about the same results.
- It's likely that my true maximum(s) are higher, such as my gap year between college and graduate school when I was basically unemployed, didn't have a girlfriend, had no responsibilities, and rode my bike a bunch. But I don't have records from then ↩︎
- I did some of this analysis a few days ago and realized I was this close 🤏🏼 to besting my previous climbing max, so I purposely did a hill repeat ride to close out the year ↩︎
A Ride In The Life
I used to do a photography project I called "A Day In The Life," where I would take photos all throughout a single day of what I did and where I went. Photos of everyday things like buildings, street scenes, people, and the like. I haven't done one in quite a long time, mostly because my days now include my children, and I don't want to plaster them all over the internet.
I ride with a GPS cyclocomputer that I've configured to record a lap every kilometer, which includes an alerting beep and a brief status screen that shows me how long I took to ride that kilometer. I started doing this when I lived in San Diego because there was a section of rolling road in Rancho Santa Fe that I would challenge myself to maintain 30 kph (or greater) on. Instead of doing mental arithmetic while hypoxic, the cyclocomputer did the math for me.
I decided to combine these two things into a "Ride In The Life," where I would take a photo of the road ahead of me every kilometer when my GPS beeped. Well, not every kilometer precisely, only when I felt safe to pull out my phone and take a picture. I didn't take any photos while descending at high speed, and if cars were passing me closely, I delayed the photo until I felt safe. The ride was one week ago and it was into the mountains west of Boulder; here is the GPS trace. I'm not sure how interesting this is, but since I went through the effort to take dozens of photos, I'm seeing it through to post them here. I hope you find them interesting!


Updated Cycling History map
Some (many!) years ago I posted a few images showing my riding history in California (in 2008) and Colorado (in 2012). While they are interesting, these are static images and cannot be explored.
Thirteen years have passed and technology has improved. Today I added a new page showing my entire cycling history since I started using GPS over twenty years ago. Instead of separate static images, it uses dynamic web technology™️ on a single map. As before, color shows how frequently I ride past a point on the map. However, I changed the logic: my previous maps used counts of observations near points, my new map uses counts of distinct rides that pass each point on the map. Instead of where I've done the most laps or my GPS has recorded the most times (for whatever reason), this is more indicative of where I ride the most.
For the most immersive experience, here is the full screen version.
My Cycling in 2024
2024 was a pretty good year for me in terms of cycling. Late in the year I purchased a new road bike which is only the third road bike I've ever owned (I bought my first racing road bike in 2001, a Trek 5200 in black with Rolf Wheels). But most of all I managed to increase the hours of cycling from 2023 by over 50%. For me, the enjoyment of cycling is proportional to the time I get to do it, so this increase has been great.
2024 was my twentieth year using a GPS to track my rides. In April 2005 I started with a Garmin Forerunner 301. Garmin had been making GPS receivers for years and this was an early athletics-focused device. Compared to modern devices it was imprecise and buggy (especially the heart rate monitor), but it was still very cool. I was a pioneer of "out front" bike mounts when I jury rigged the 301 to my handlebars. Not long after moving to Colorado in 2010 I upgraded to a Garmin Edge 705 that was bike-specific and had a host of upgrades, including maps, a cadence sensor, a color screen, and a barometric altimeter. A couple years ago I upgraded again to a Garmin Edge 530 which is even more accurate with the addition of GLONASS and Galileo compatibility.
I started using GPS in 2005 a full four years before Strava existed. A few years ago I took the time to upload my full history to Strava including activities that predate Strava. It's kind of fun looking at these old rides, I have historical KOMs all over San Diego. They have long been claimed by other riders, but because I was the only one using GPS back then I was the fastest!
Below I've compiled some statistics in bar chart form covering all my rides with GPS data since 2005. There are a few very clear trends:
- Through 2010 the activity trend is downwards as I sacrificed riding time in the interest of finishing my PhD (2005 is lower simply because I didn't get the Garmin until April)
- My peak year is 2011, my first full year after finishing my PhD and my second to last full childless year
- Totals continue to trend downwards with another child in 2016, and then only start to rebound in 2019 and ongoing as the children get older and require less attention
- 2018 was super rough; only 28 hours of recreational riding over the whole year
The bottom two graphs, the average speed (KPH) and rate of climbing (Meters/Kilometer), show some interesting things:
- All the years with better than 24KPH average speeds are years I think I preferred road cycling over mountain biking. For example, in 2019 I got a new mtb and I wanted to ride that all the time. Mountain biking is way slower than road biking and 2019 has the lowest average speed
- Correlated, I think all the years with more than 12 meters / kilometer of climbing are years I preferred mountain biking. Again, 2019 is an outlier because I did proportionally more mountain biking
- Years before 2010 are mostly in San Diego. It's hard to disentangle the fast speeds 2005-2007 between being younger, still racing, doing less elevation, and less mountain biking. San Diego is not flat, but it's harder to get the kind of elevation changes available along the Colorado front range
I have not included the distance I commute by bike in these plots because I can't be bothered to turn on GPS tracking when I commute. It's likely that each of the last few years, perhaps since 2019, I've commuted 500-1,000 KM by bike each year.
The plots below are interactive thanks to Plotly, a tool I highly recommend!
My Colorado Rides
Below is a kernel-density map showing where and how often I've ridden my bike around Boulder in the last year and a half. I've posted things like this before for my rides in California. The color map (the legend is in the bottom-left corner) indicates that anywhere there's a green dot, I've cycled through there at most a few times, and anything between blue and purple are my usual routes. There are a few red points mainly centered around where I live, which corresponds to places I've been through a few hundreds of times.
Looking at the map, I'm a bit surprised at the amount of exploring I've done out in the plains. I didn't realize I had done that much out there. I also want to note that most of the dead-end segments are due to geography - the roads end where the segments do.

Kilometers and Memories
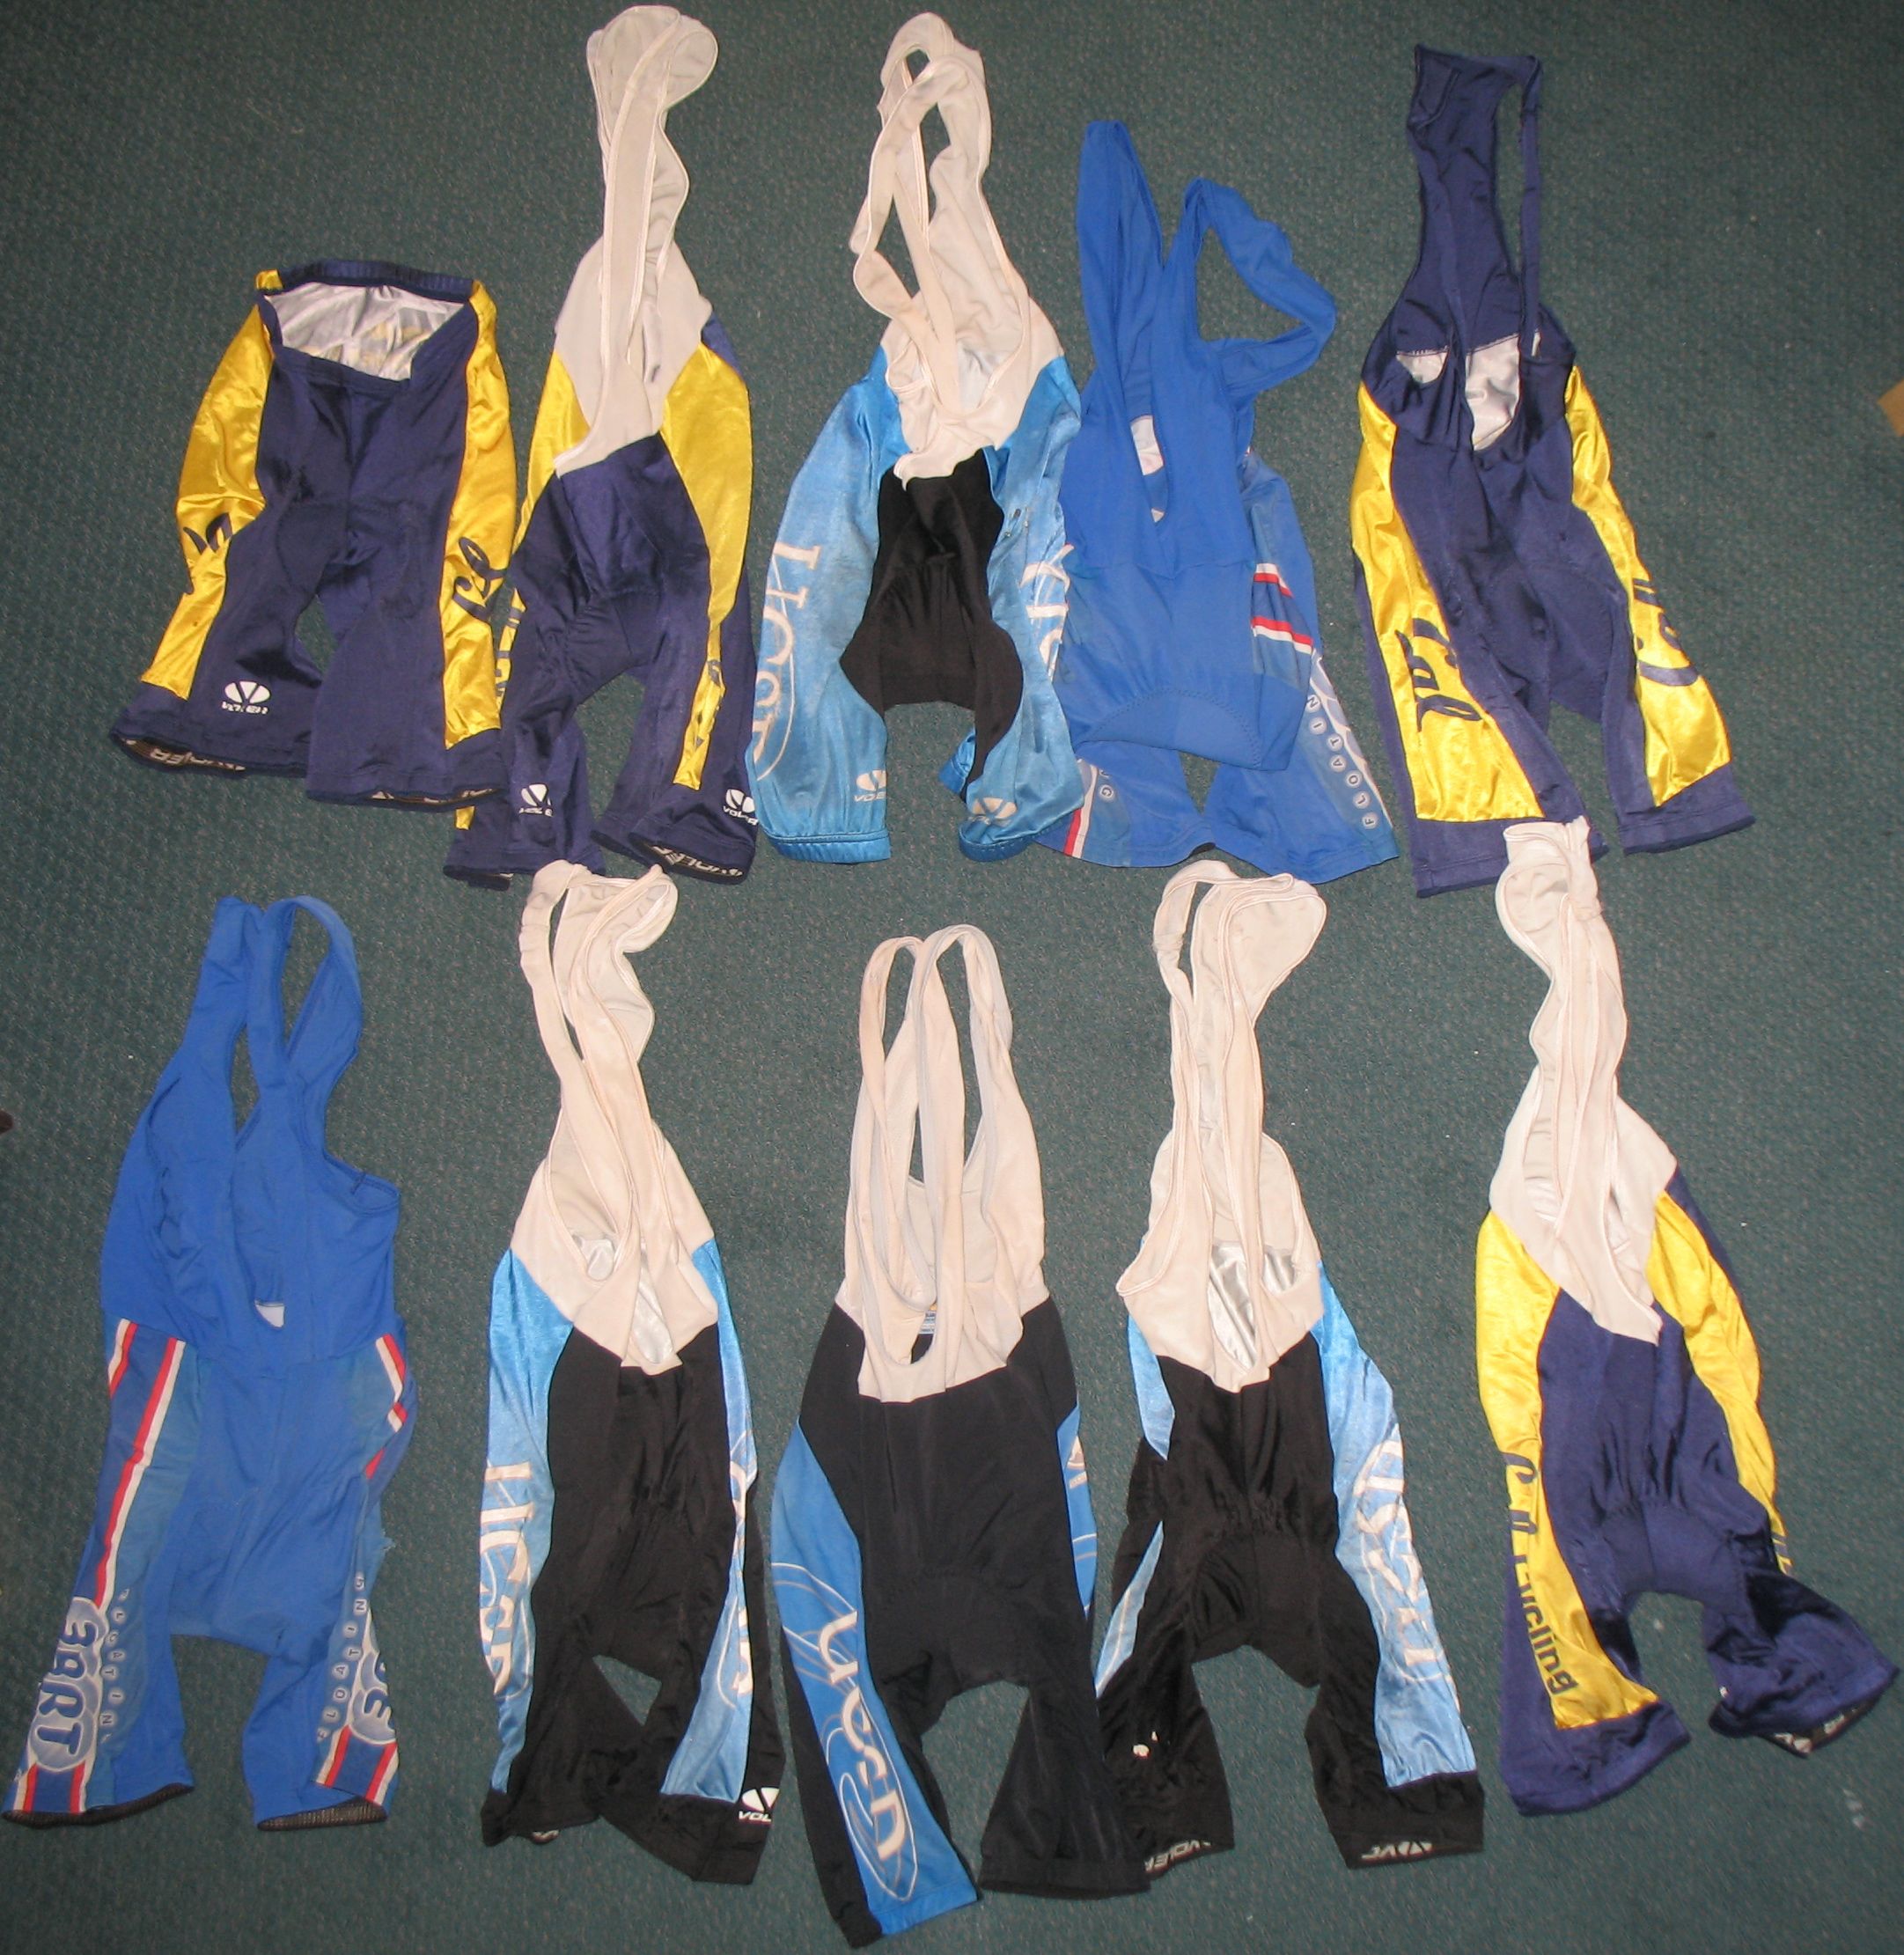
Above are my cycling shorts that are too old, too thin, too ripped and too transparent to wear anymore. For precisely the same reason I should get rid of them, I want to keep them. I have ridden many kilometers wearing these shorts (at least 30,000 kilometers worth in this photo, likely much more) and made lots of memories. All of my Cal Cycling shorts, and most of my UCSD Cycling shorts are worn out. But they are taking up space, and I can't imagine wearing them ever again. I intend on eventually purchasing new kits from my former cycling teams to replace these, but it won't be the same. I am in mourning.
My Eddington Number is 48
A couple days ago I was browsing the internet on astrophysical topics, when I came across Sir Arthur Stanley Eddington's wikipedia page. He's best known for the Eddington limit, which describes the luminosity limit of a star as a function of its mass. Near the bottom of his page linked above, there is a description of the "Eddington number," which for any person is the greatest number of bike rides they done which have been that at least that number in miles long. From the wikipedia page:
The Eddington Number in this context is defined as E, the number of days a cyclist has cycled more than E miles. For example an Eddington Number of 70 would imply that a cyclist has cycled more than 70 miles in a day on 70 occasions.
This is very similar to the Erdős number and the h-index, which measure a scientists publishing impact. I don't have an Erdős number, nor an h-index, but I do have an Eddington number. And since I have a nice GPS database of my rides, I figured I could easily calculate it.
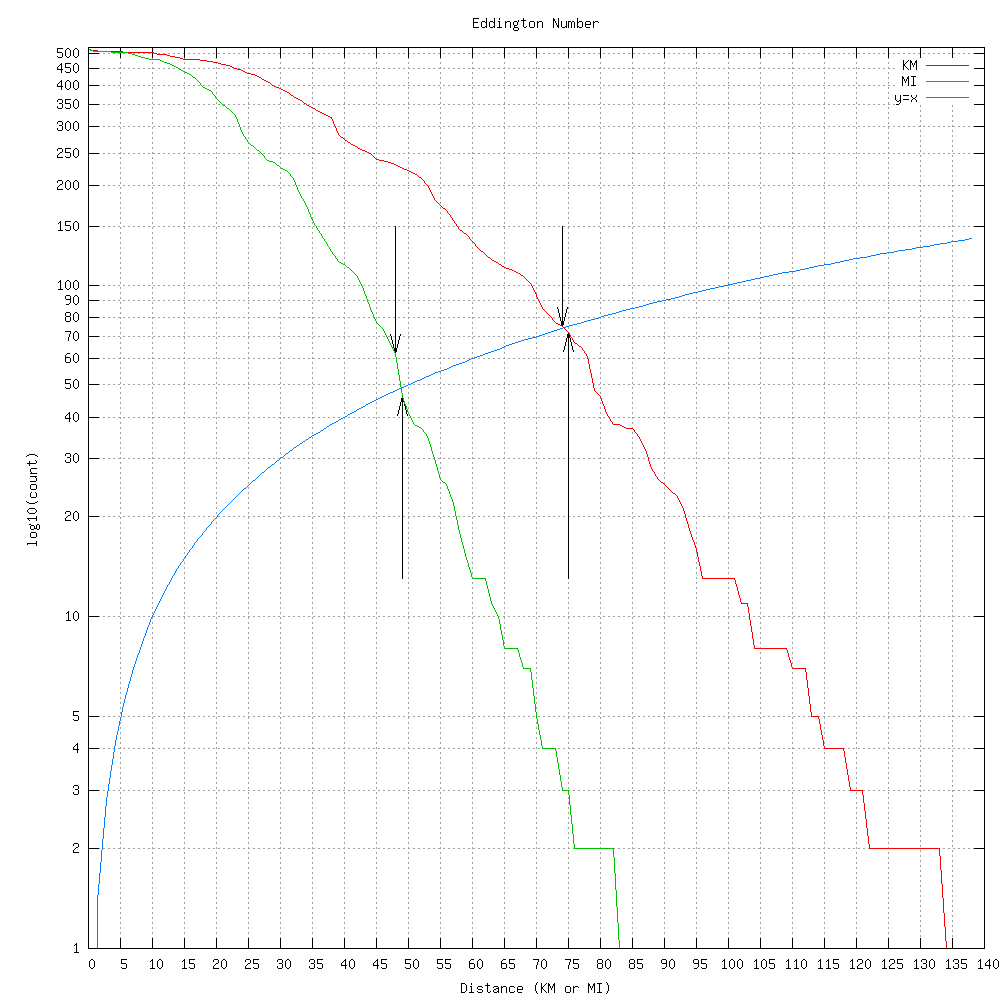
Above shows two Eddington calculations, in miles and in kilometers. The curved blue line is x=y, and it's curved because the y axis is using a logscale. Where the blue line intersects the Eddington lines is my Eddington number. The downward arrows show my actual integer Eddington numbers (48 for miles, 74 for kilometers), while the upward arrows show that 49 and 75 aren't above the blue line, and thus aren't my Eddington numbers. Since the definition is in miles, my true number is 48, but the kilometer calculation shows that the number is also a function of your unit.
Unfortunately, I don't have records before I got my GPS, so my true Eddington number is surely larger.
Ride History Mashup
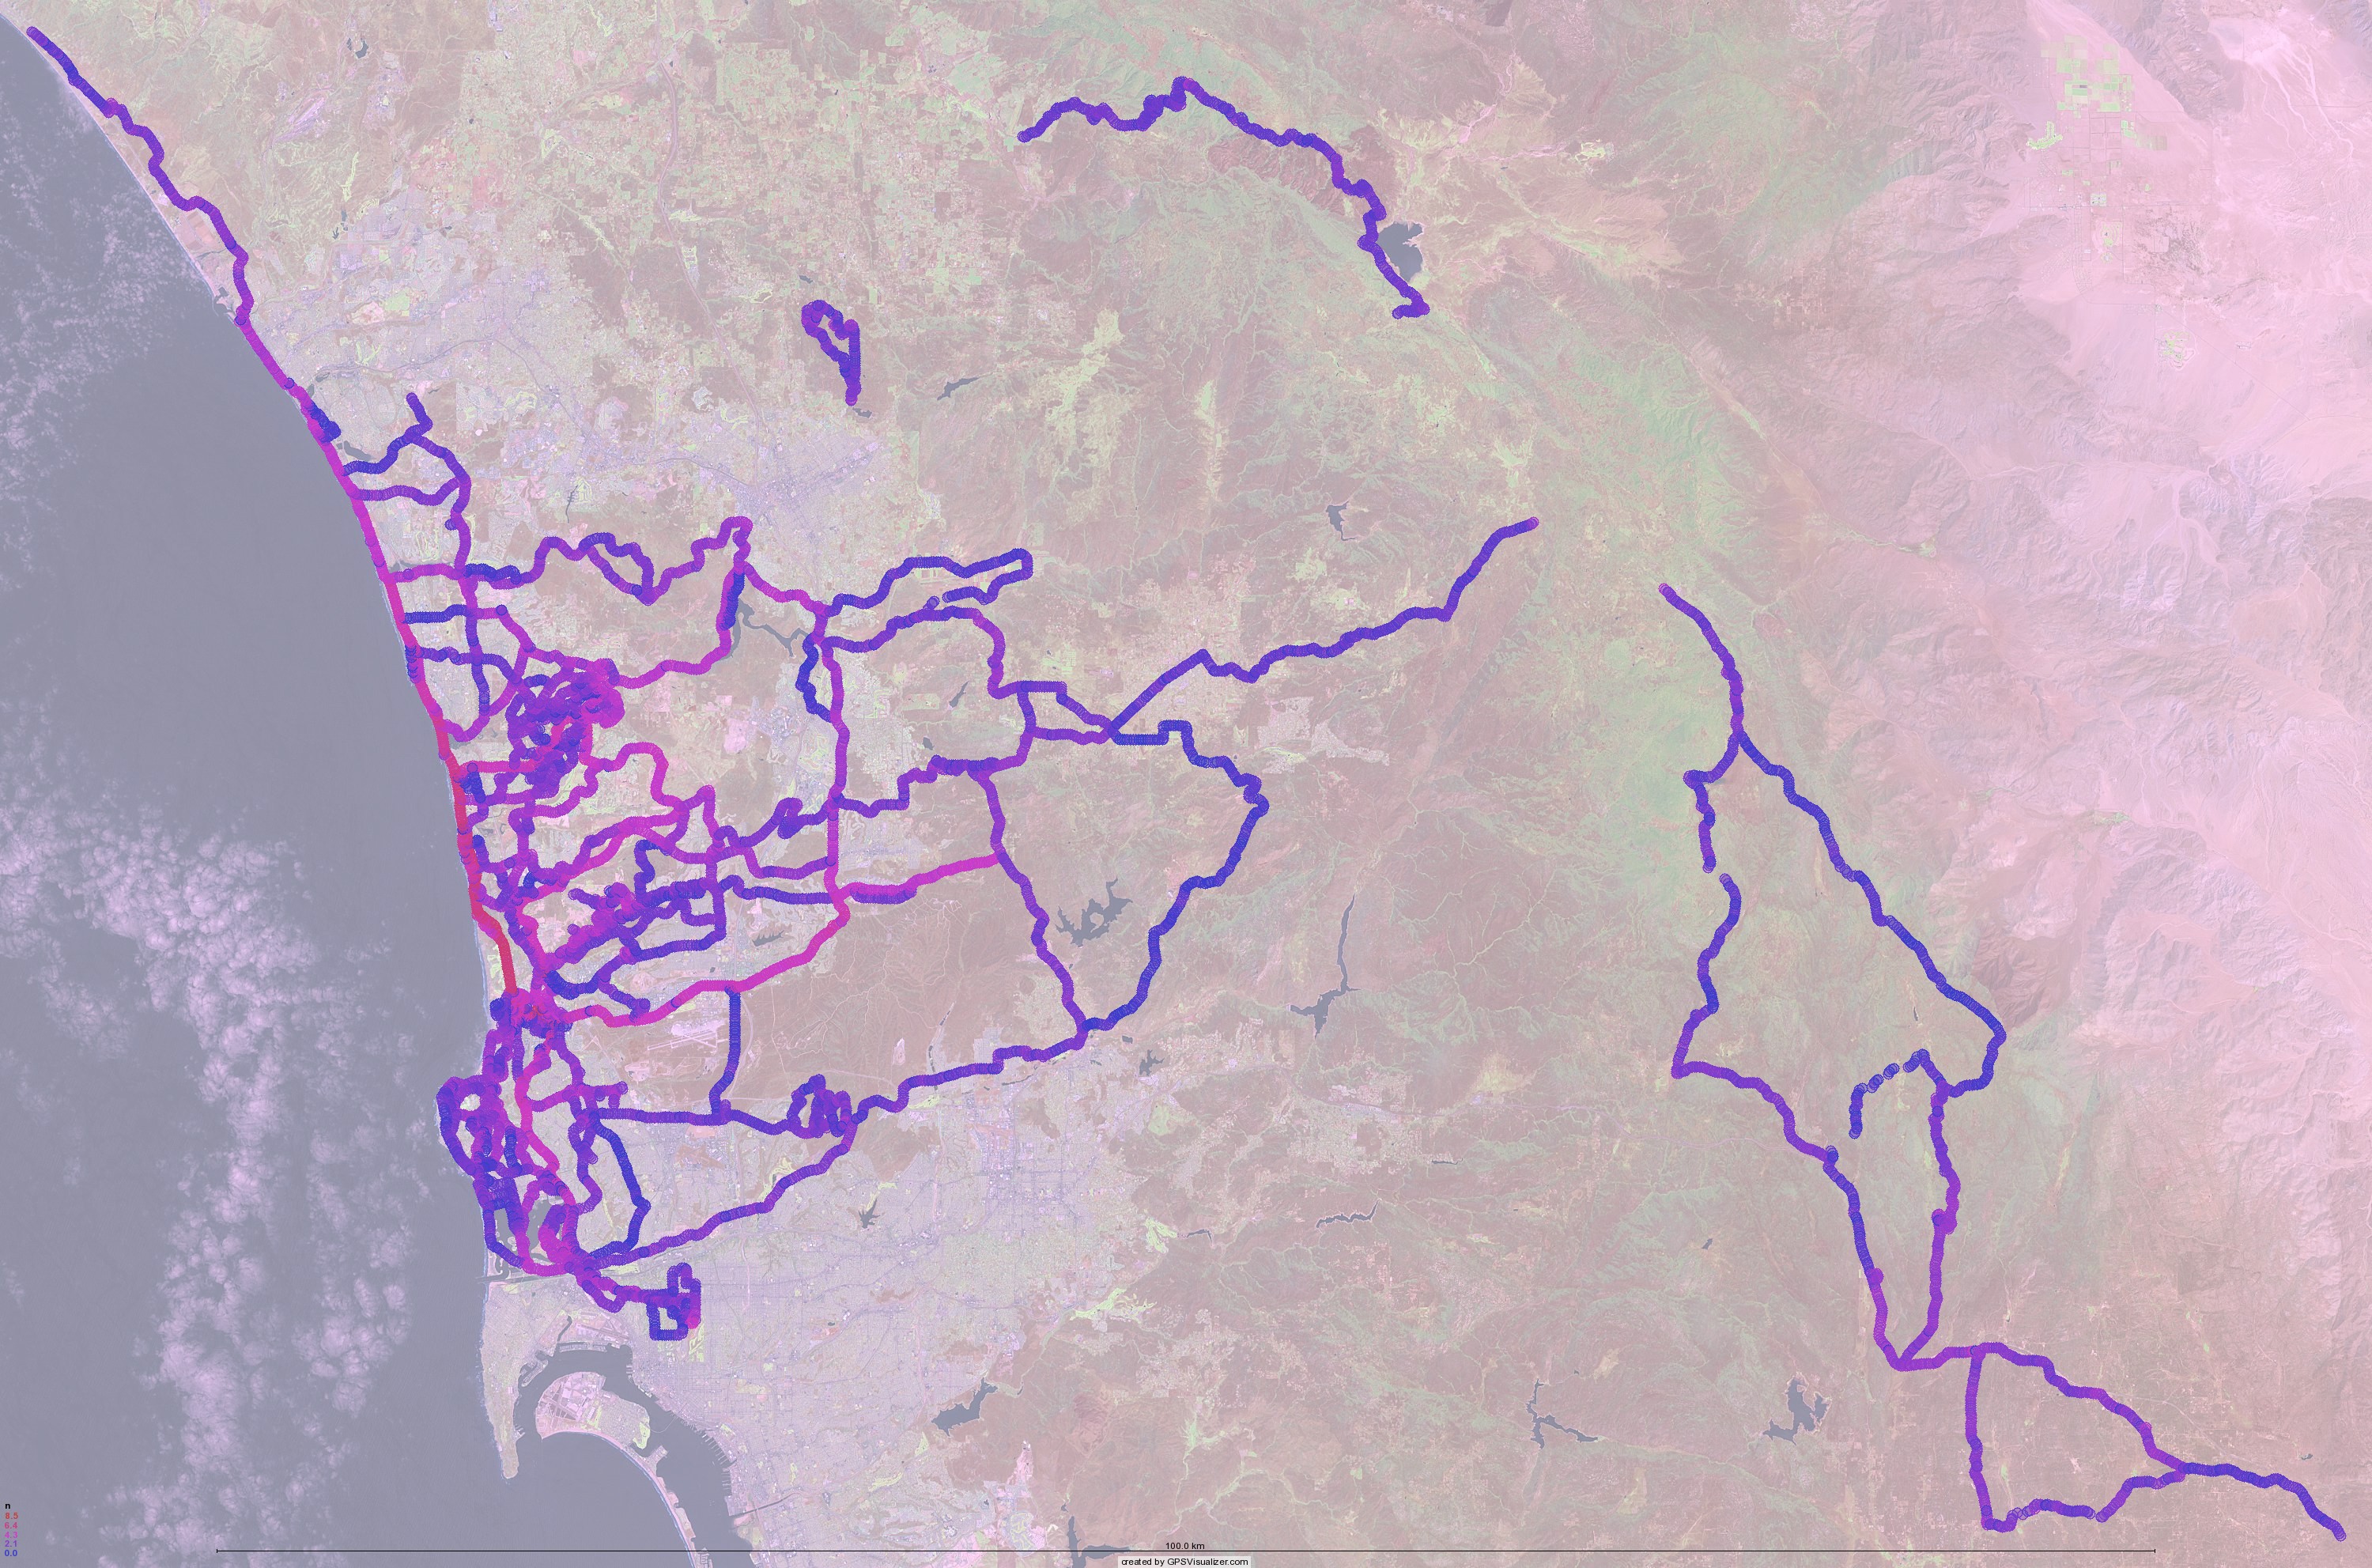
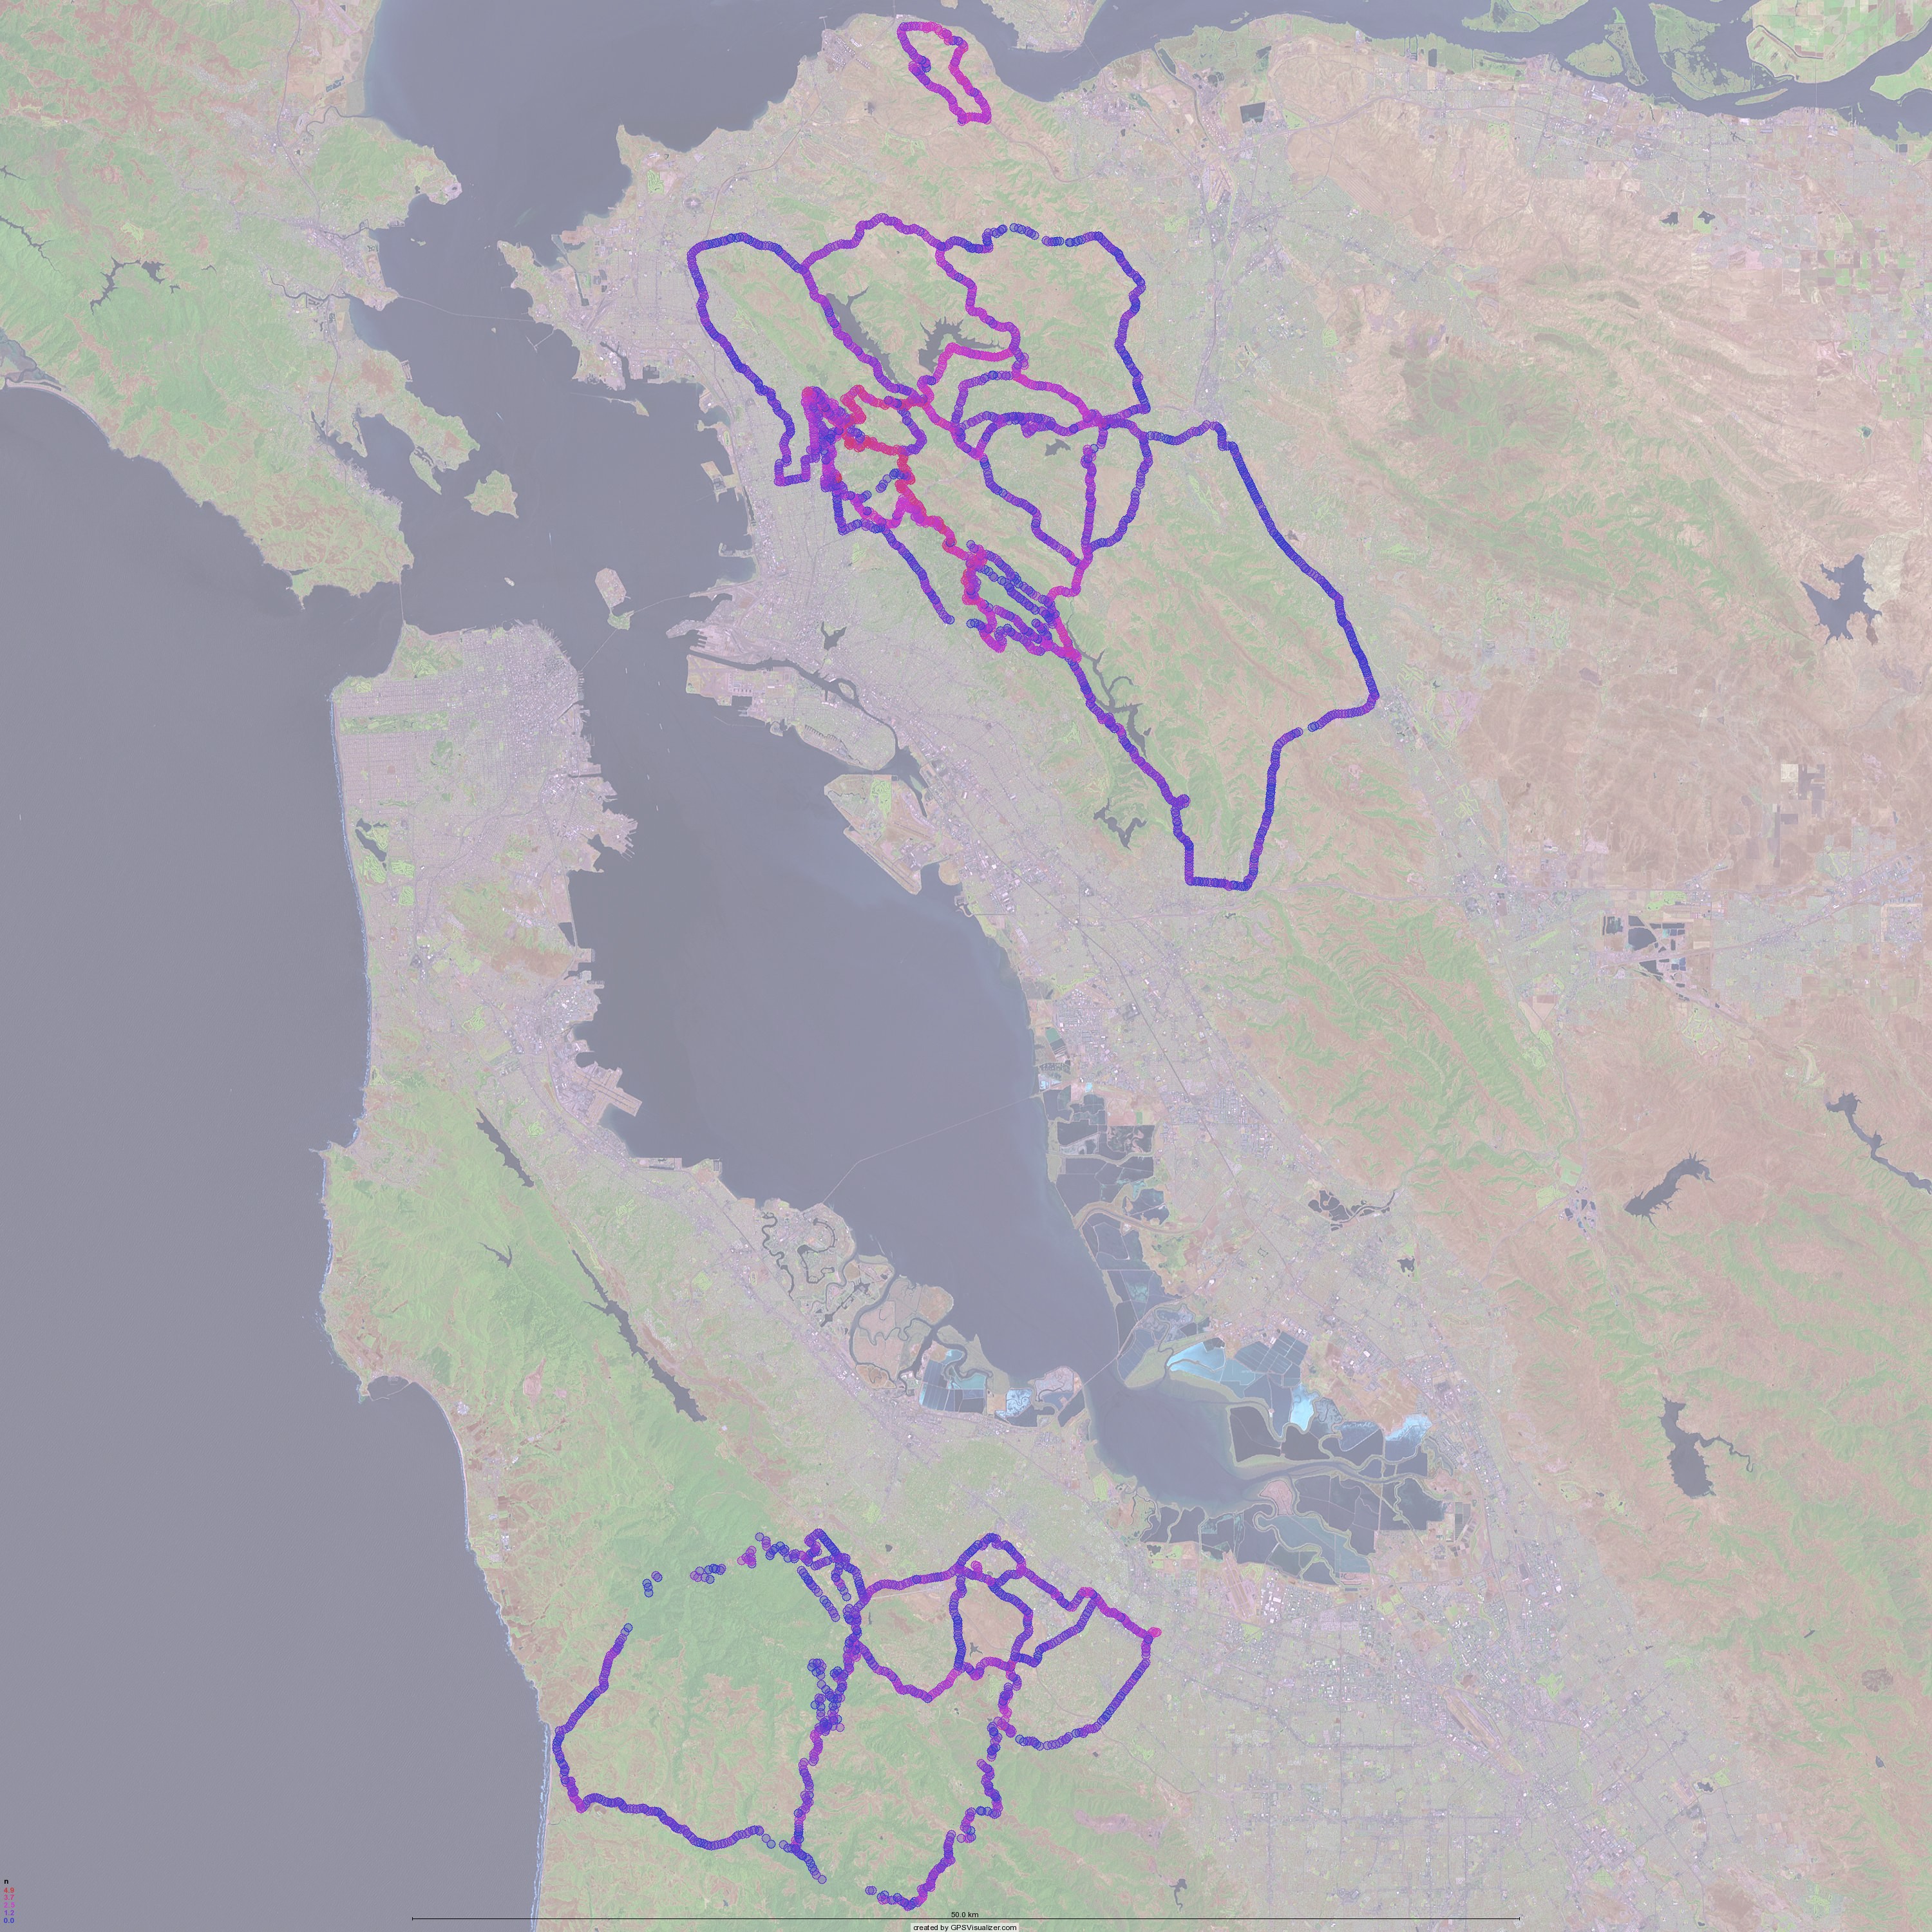
Below are some mashups showing the frequency density of where I have ridden my bikes in the last three years. (I never use my GPS on the track, so velodrome riding is not represented here. And besides, that isn't very interesting.) The circles on the maps represent a place I have passed through, and the color how many times. Red means many, perhaps as many as 5000 times for the area near my apartment, and blue means few, as few as once. That 5000 doesn't mean I've done 5000 rides, it means that there are 5000 GPS waypoints in the 100 meter radius circle around that particular point. As waypoints are recorded closer than 100m apart, the same ride could have multiple waypoints inside each circle. Also note that the circles on the map are much larger than 100m.
Click on each for a larger view.
I made a Google Earth KMZ file containing all the points. If you open it, be patient as it will take a bit of time to load. Download it here.
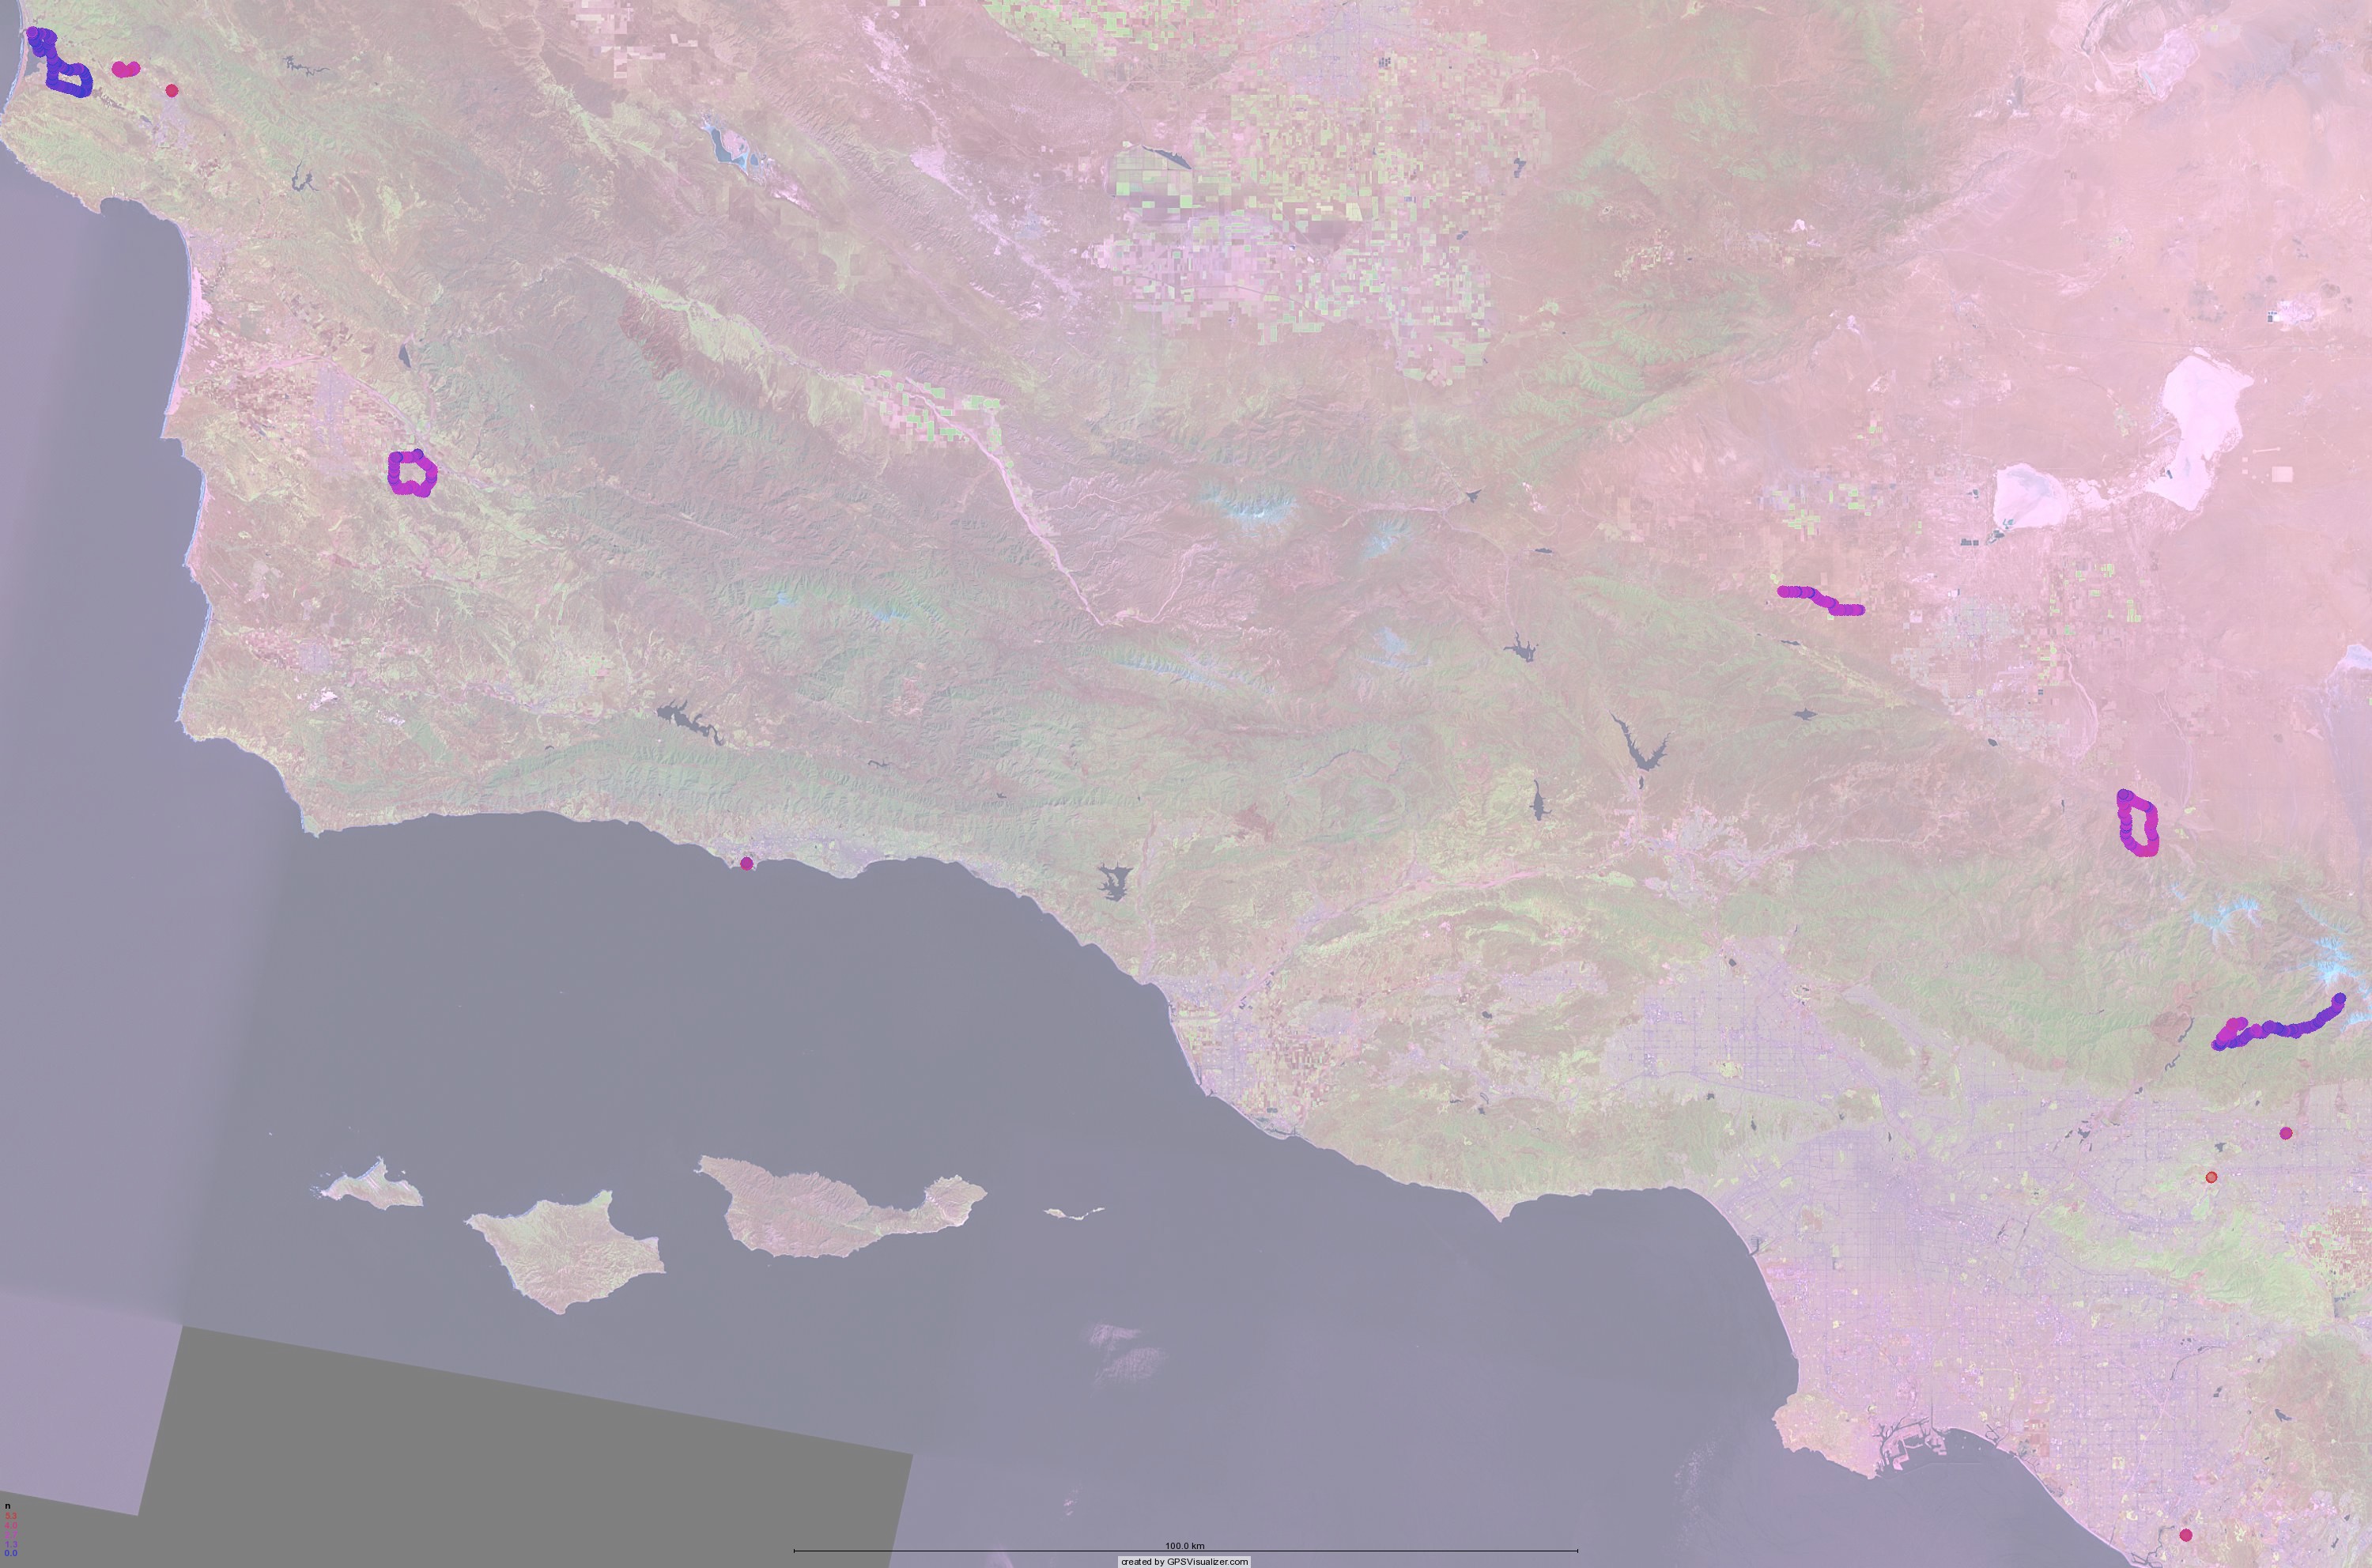
I think I'm planning on posting the code here, as I think other people might like this fun bit of code. But I want to clean it up a bit before I make it public.