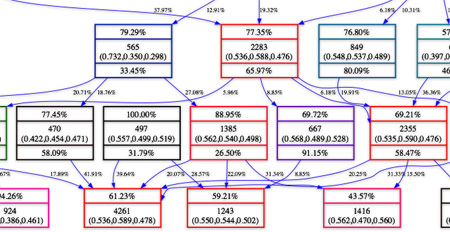
Above is a part of what I've been working on lately. It's a small part of the galaxy family tree that I've derived from a large simulation. In the simulation there are several ingredients that are thrown in the "box." Relevant to this are the dark matter particles, which coalesce into consituents of galaxies. The dark matter particles have unique id numbers. Using a some code I didn't write, I process the simulation data and make a list of galaxies along with the particles in each galaxy. Then, using some code I did write, I track particles and galaxies over a number of time steps, which builds a relational mapping. Then, I use Graphviz to make a nice tree, as you see above.
Inside each box are either three or four data values. The top grid shows what percentage of the particles in that group came from no group, the middle grid shows both the number of dark matter particles that are in the group and the position of the group, while the bottom grid shows the percentage of the particles that go to no group. The simulation takes place inside of a 3D box with length 1 on a side and periodic boundaries (which means the distance between 0.9 and 0.1 is 0.2, not 0.8). The colors of the box correspond to its ranking in size, red is the largest, green the smallest. The numbers next to the arrows are what percentage of the parent group goes to the child group.
The goal of this is to get an idea of how the galaxies form over the course of the simulation. Of course the simulation tries to mirror reality, so this family tree may be worth something.
