Updated Cycling History map
Some (many!) years ago I posted a few images showing my riding history in California (in 2008) and Colorado (in 2012). While they are interesting, these are static images and cannot be explored.
Thirteen years have passed and technology has improved. Today I added a new page showing my entire cycling history since I started using GPS over twenty years ago. Instead of separate static images, it uses dynamic web technology™️ on a single map. As before, color shows how frequently I ride past a point on the map. However, I changed the logic: my previous maps used counts of observations near points, my new map uses counts of distinct rides that pass each point on the map. Instead of where I've done the most laps or my GPS has recorded the most times (for whatever reason), this is more indicative of where I ride the most.
For the most immersive experience, here is the full screen version.
more ...My Listening to Music in 2024
I don't subscribe to Spotify, so I don't get an end-of-year Spotify Wrapped summary. But not to be outdone, Last.fm offers a "Playback" report. It's basically the same thing as Wrapped except that Last.fm waits until the year is actually over before sending out the report.
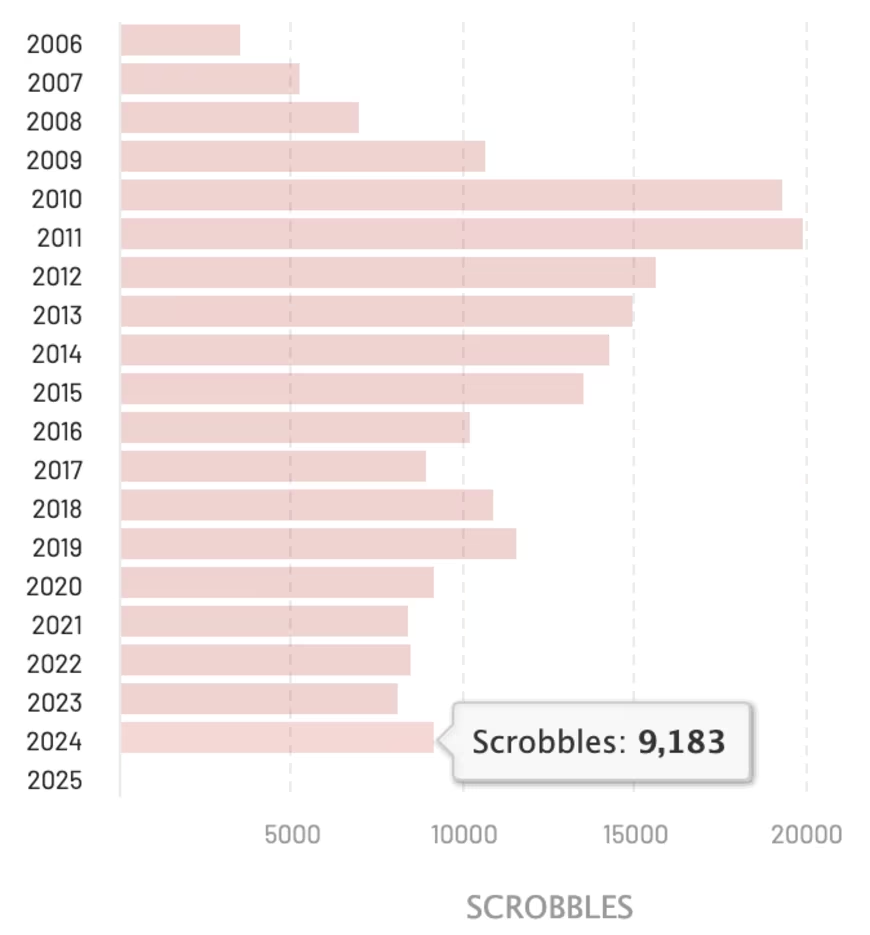
I managed to scrobble a few more tracks than last year:
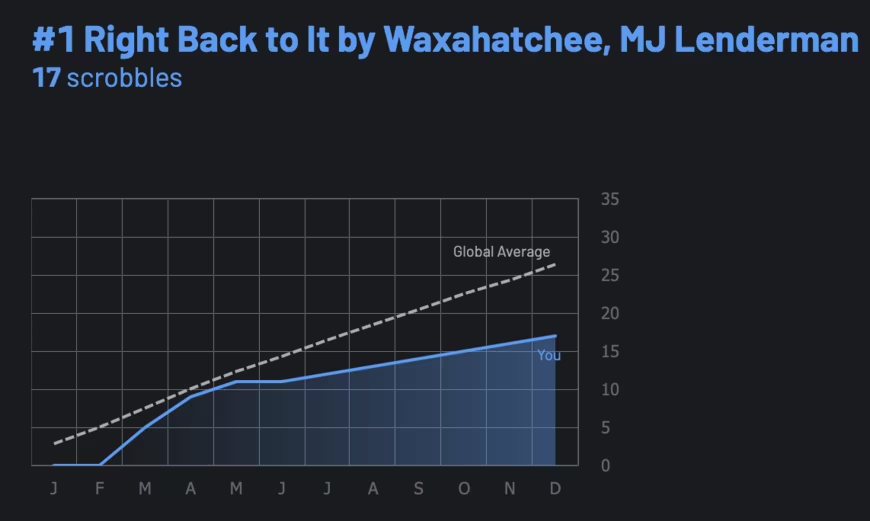
My Playback report isn't all that interesting so it's not worth sharing. What I do want to highlight from it is the need for people to learn when to use averages, and when to use medians. Here is one of the factoids my report tells me, that my top track was Right Back to It by Waxahatchee with MJ Lenderman. My 17 listens puts me in the top 5% of listeners of that song.

Next, the reports gives me this graph which shows the cumulative number of listens to the track by me and by the average of all users who also listened at least once. Despite being in the top 5% of all listeners, you'll notice that my line is below the average line. These two facts combine to illustrate why averages are often misleading, and medians are more informative.
Let's put it this way, if I was serving food with Warren Buffet at a shelter for 100 homeless people, on average we would all be billionaires. Then asking the question "on average you're all billionaires, why are most of you homeless?" abuses statistics. The median wealth in that shelter would be zero, which is far more accurate of the financial condition of most of the people there.
In the same way as a few people can be immensely wealthy and skew averages into meaninglessness, all it takes is a few people who put Right Back to It on repeat to heavily skew the plot into absurdity. It's likely that the median line for this track might be nearly flat at just a few plays. Maybe the people at Last.fm think that looks funny, but if I'm in the top 5% of listeners, my listening history should look very different from the median (most other) listeners!
Here's the end of year report I'm sending to Last.fm:

My Cycling in 2024
2024 was a pretty good year for me in terms of cycling. Late in the year I purchased a new road bike which is only the third road bike I've ever owned (I bought my first racing road bike in 2001, a Trek 5200 in black with Rolf Wheels). But most of all I managed to increase the hours of cycling from 2023 by over 50%. For me, the enjoyment of cycling is proportional to the time I get to do it, so this increase has been great.
2024 was my twentieth year using a GPS to track my rides. In April 2005 I started with a Garmin Forerunner 301. Garmin had been making GPS receivers for years and this was an early athletics-focused device. Compared to modern devices it was imprecise and buggy (especially the heart rate monitor), but it was still very cool. I was a pioneer of "out front" bike mounts when I jury rigged the 301 to my handlebars. Not long after moving to Colorado in 2010 I upgraded to a Garmin Edge 705 that was bike-specific and had a host of upgrades, including maps, a cadence sensor, a color screen, and a barometric altimeter. A couple years ago I upgraded again to a Garmin Edge 530 which is even more accurate with the addition of GLONASS and Galileo compatibility.
I started using GPS in 2005 a full four years before Strava existed. A few years ago I took the time to upload my full history to Strava including activities that predate Strava. It's kind of fun looking at these old rides, I have historical KOMs all over San Diego. They have long been claimed by other riders, but because I was the only one using GPS back then I was the fastest!
Below I've compiled some statistics in bar chart form covering all my rides with GPS data since 2005. There are a few very clear trends:
- Through 2010 the activity trend is downwards as I sacrificed riding time in the interest of finishing my PhD (2005 is lower simply because I didn't get the Garmin until April)
- My peak year is 2011, my first full year after finishing my PhD and my second to last full childless year
- Totals continue to trend downwards with another child in 2016, and then only start to rebound in 2019 and ongoing as the children get older and require less attention
- 2018 was super rough; only 28 hours of recreational riding over the whole year
The bottom two graphs, the average speed (KPH) and rate of climbing (Meters/Kilometer), show some interesting things:
- All the years with better than 24KPH average speeds are years I think I preferred road cycling over mountain biking. For example, in 2019 I got a new mtb and I wanted to ride that all the time. Mountain biking is way slower than road biking and 2019 has the lowest average speed
- Correlated, I think all the years with more than 12 meters / kilometer of climbing are years I preferred mountain biking. Again, 2019 is an outlier because I did proportionally more mountain biking
- Years before 2010 are mostly in San Diego. It's hard to disentangle the fast speeds 2005-2007 between being younger, still racing, doing less elevation, and less mountain biking. San Diego is not flat, but it's harder to get the kind of elevation changes available along the Colorado front range
I have not included the distance I commute by bike in these plots because I can't be bothered to turn on GPS tracking when I commute. It's likely that each of the last few years, perhaps since 2019, I've commuted 500-1,000 KM by bike each year.
The plots below are interactive thanks to Plotly, a tool I highly recommend!
more ...