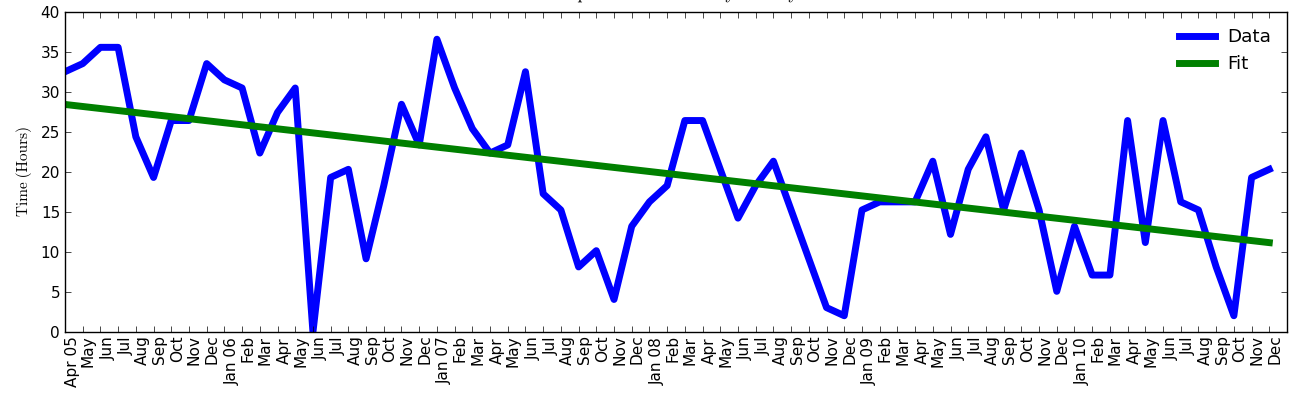
Above is a plot showing how many hours I have logged on my Garmin GPS devices since I got my first one in April 2005. This is mostly cycling, but also walking, running and some hiking. However, this is not a true measure of my physical activity over this period because it is missing data. Up to late 2007, I was active on the velodrome, and I didn't bother using my GPS there. In the last year, I've tried to walk to school more often, and for the most part I haven't used my Garmin on those walks. But it does capture the majority of my physical activity, which is road and mountain biking, where I always use a GPS.
In green I've over-plotted a linear fit to the data. I have chosen a linear fit as it shows the overall trend in the clearest way possible. For some reason, June 2006 shows zero hours, which I believe to be wrong. I can't believe I did nothing at all during any summer month in 2006. Therefore, for purposes of the fit, I have given that month the average hours of the four bracketing months.
Even knowing that lots of data is missing from both the front- and back-ends of the figure, it is still clear what the overall trend was. Down - down significantly from nearly 30 hours a month five years ago to just above 10. There of course is a great variability from month to month, but the fit shows clearly the overall trend of what trying to finish graduate school does to physical activity.
I find the lack of patterns interesting. Some years, I really struggled to stay active during the late fall, which makes a certain amount of sense when weather and schoolwork is factored in. However, other years it apparently didn't affect me at all. The bounce in hours since October 2010 makes sense because that's when I graduated, but the two months in 2010 with 25+ hours is confusing. I can't remember how I achieved that!
Nerd time: I made the figure in Python using matplotlib and numpy. Excel is for suckers!