Warren G - Regulate… G Funk Era
A few weeks ago I reviewed the Above the Rim Soundtrack. This week's album, Regulate… G Funk Era, also includes the hit "Regulate" which propelled that earlier album to high sales. Regulate… is at #3 this week.
Overall this album is decent mid-90s West Coast Hip-Hop. As I wrote in the earlier post, this album is worth quite a bit more than the Above the Rim soundtrack. So listen to this one, and ignore the other one.
more ...Stone Temple Pilots - Purple
For the second week in a row an album debuts at #1 for its first week on the charts. Purple by Stone Temple Pilots is an album that has continued to get radio airplay in the 30 years since it was released. Their first album, Core, is one of the great Grunge Rock albums. Purple is more radio-friendly, but also more psychedelic when compared to Core.
According to last.fm I've listened to tracks off this album over 250 times since 2006. It is likely that I will continue to listen to it, and so should you.
more ...Meow Wolf
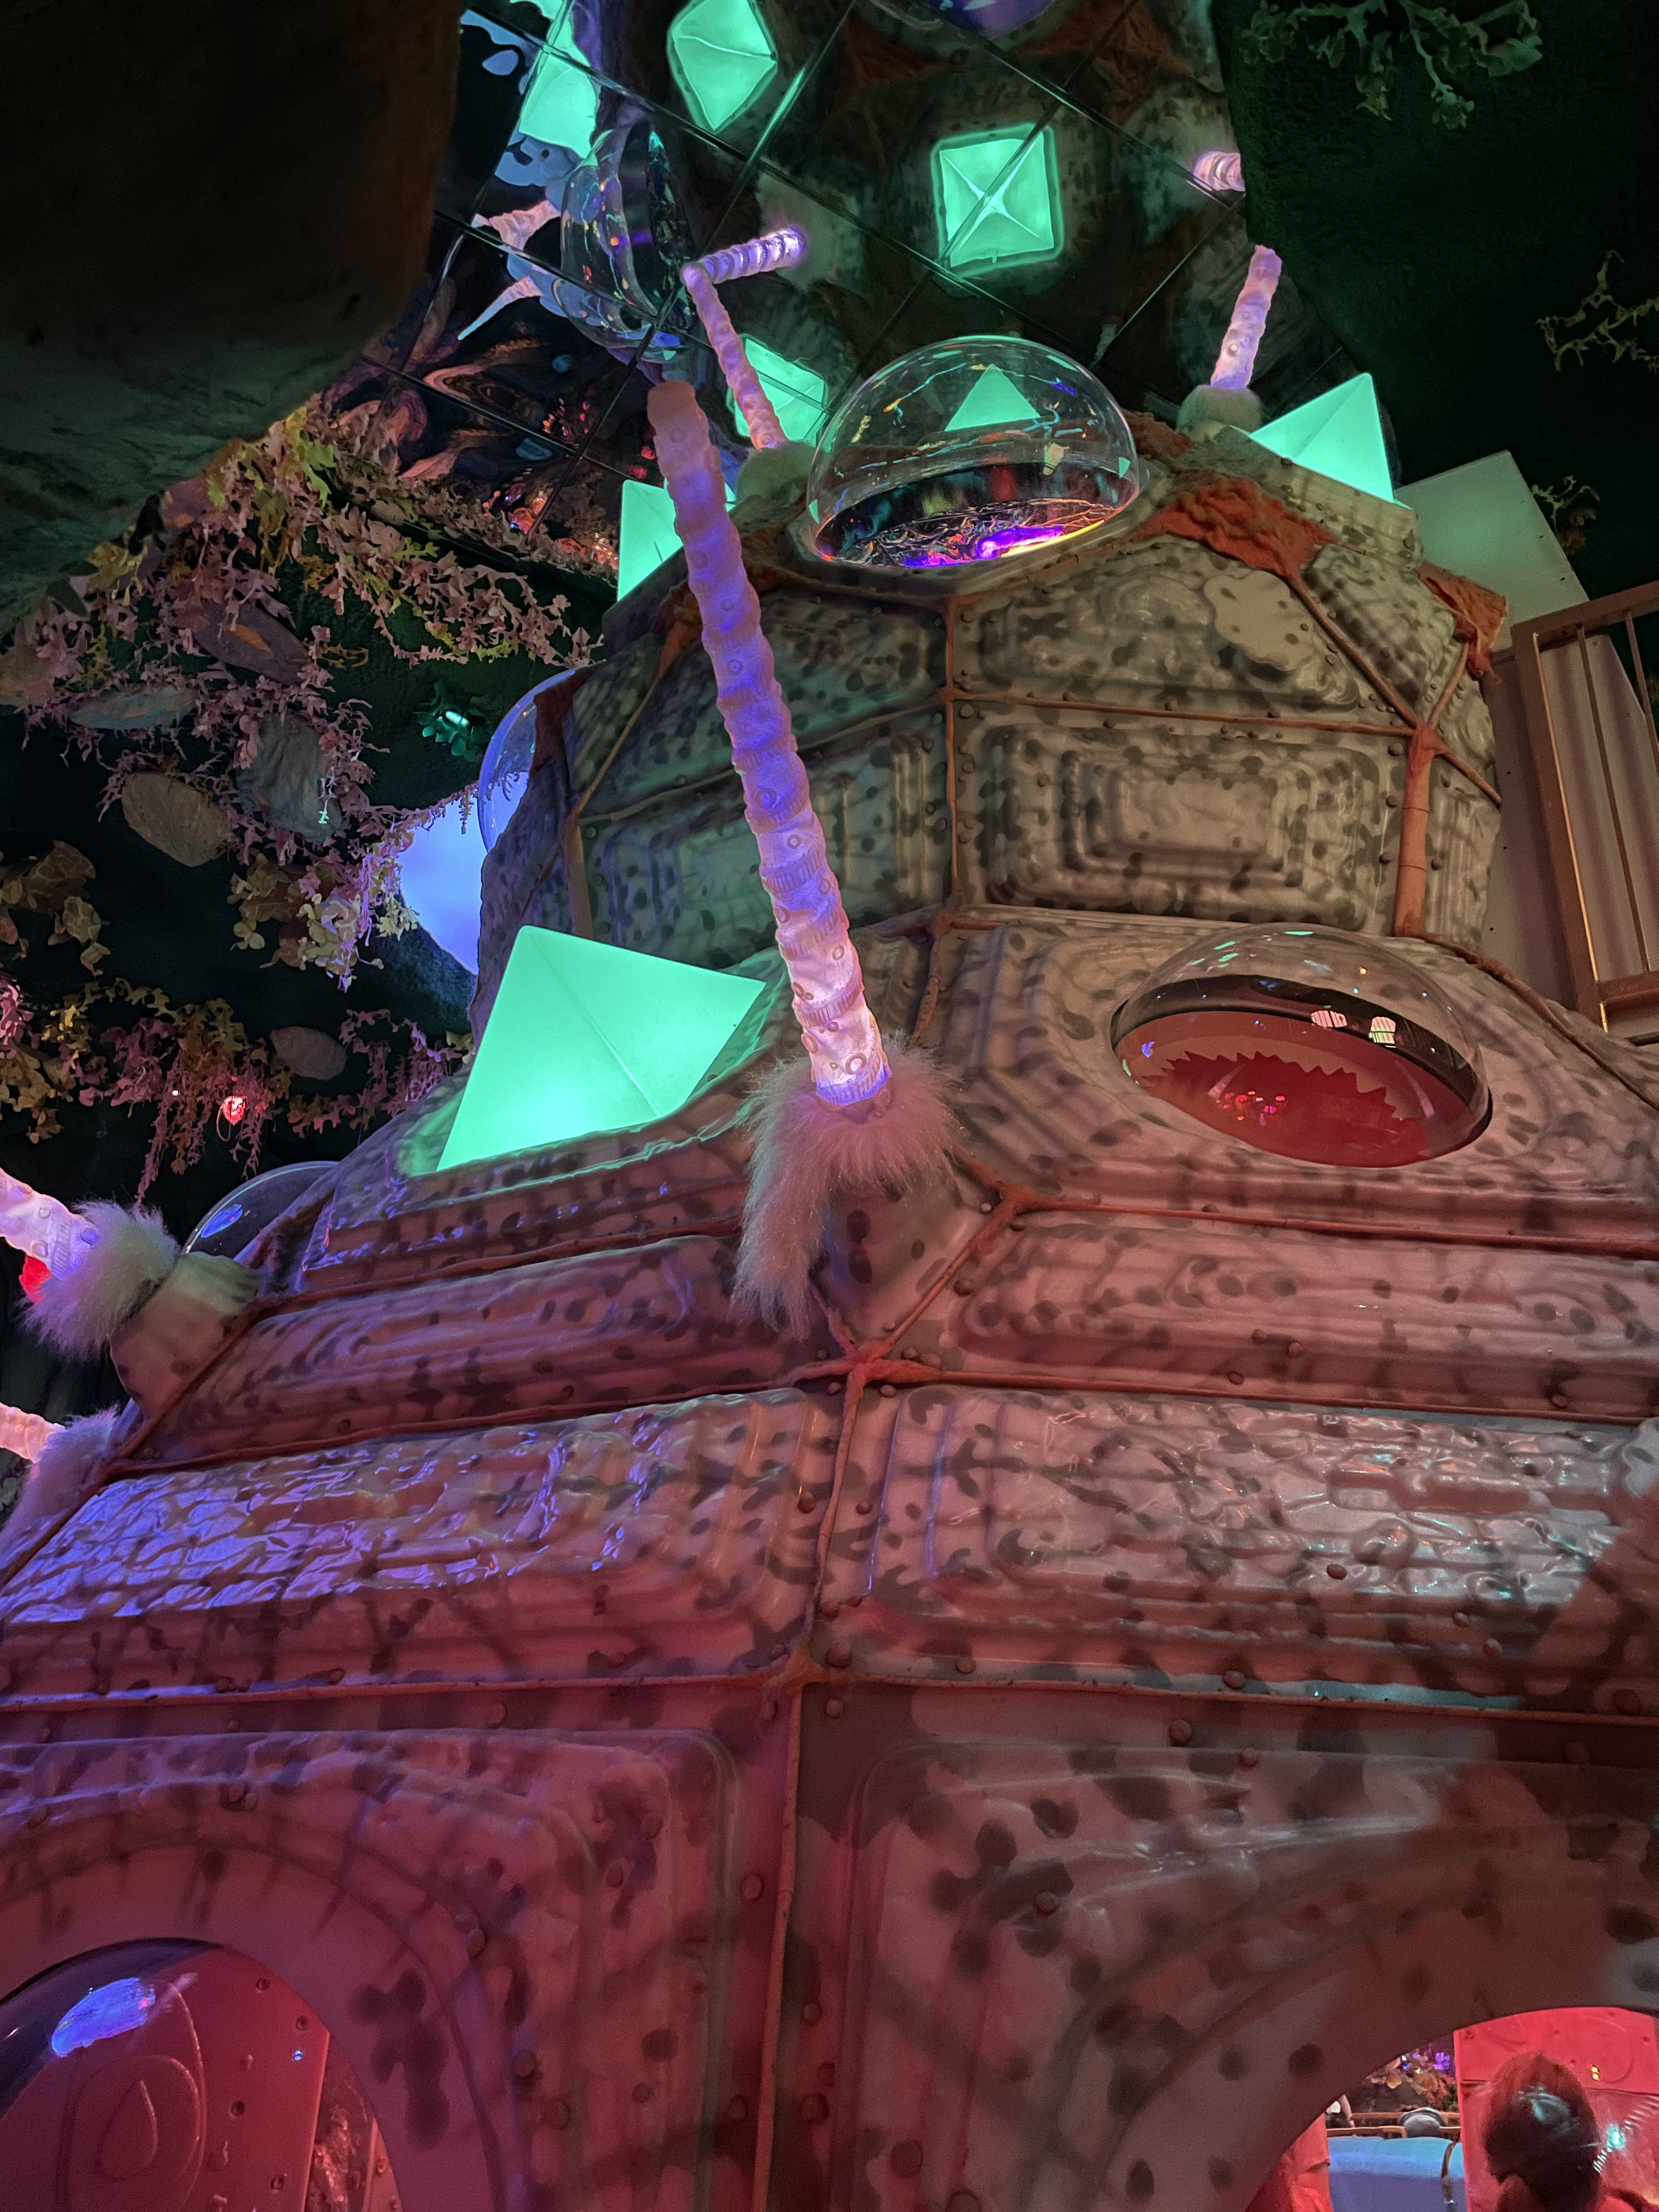
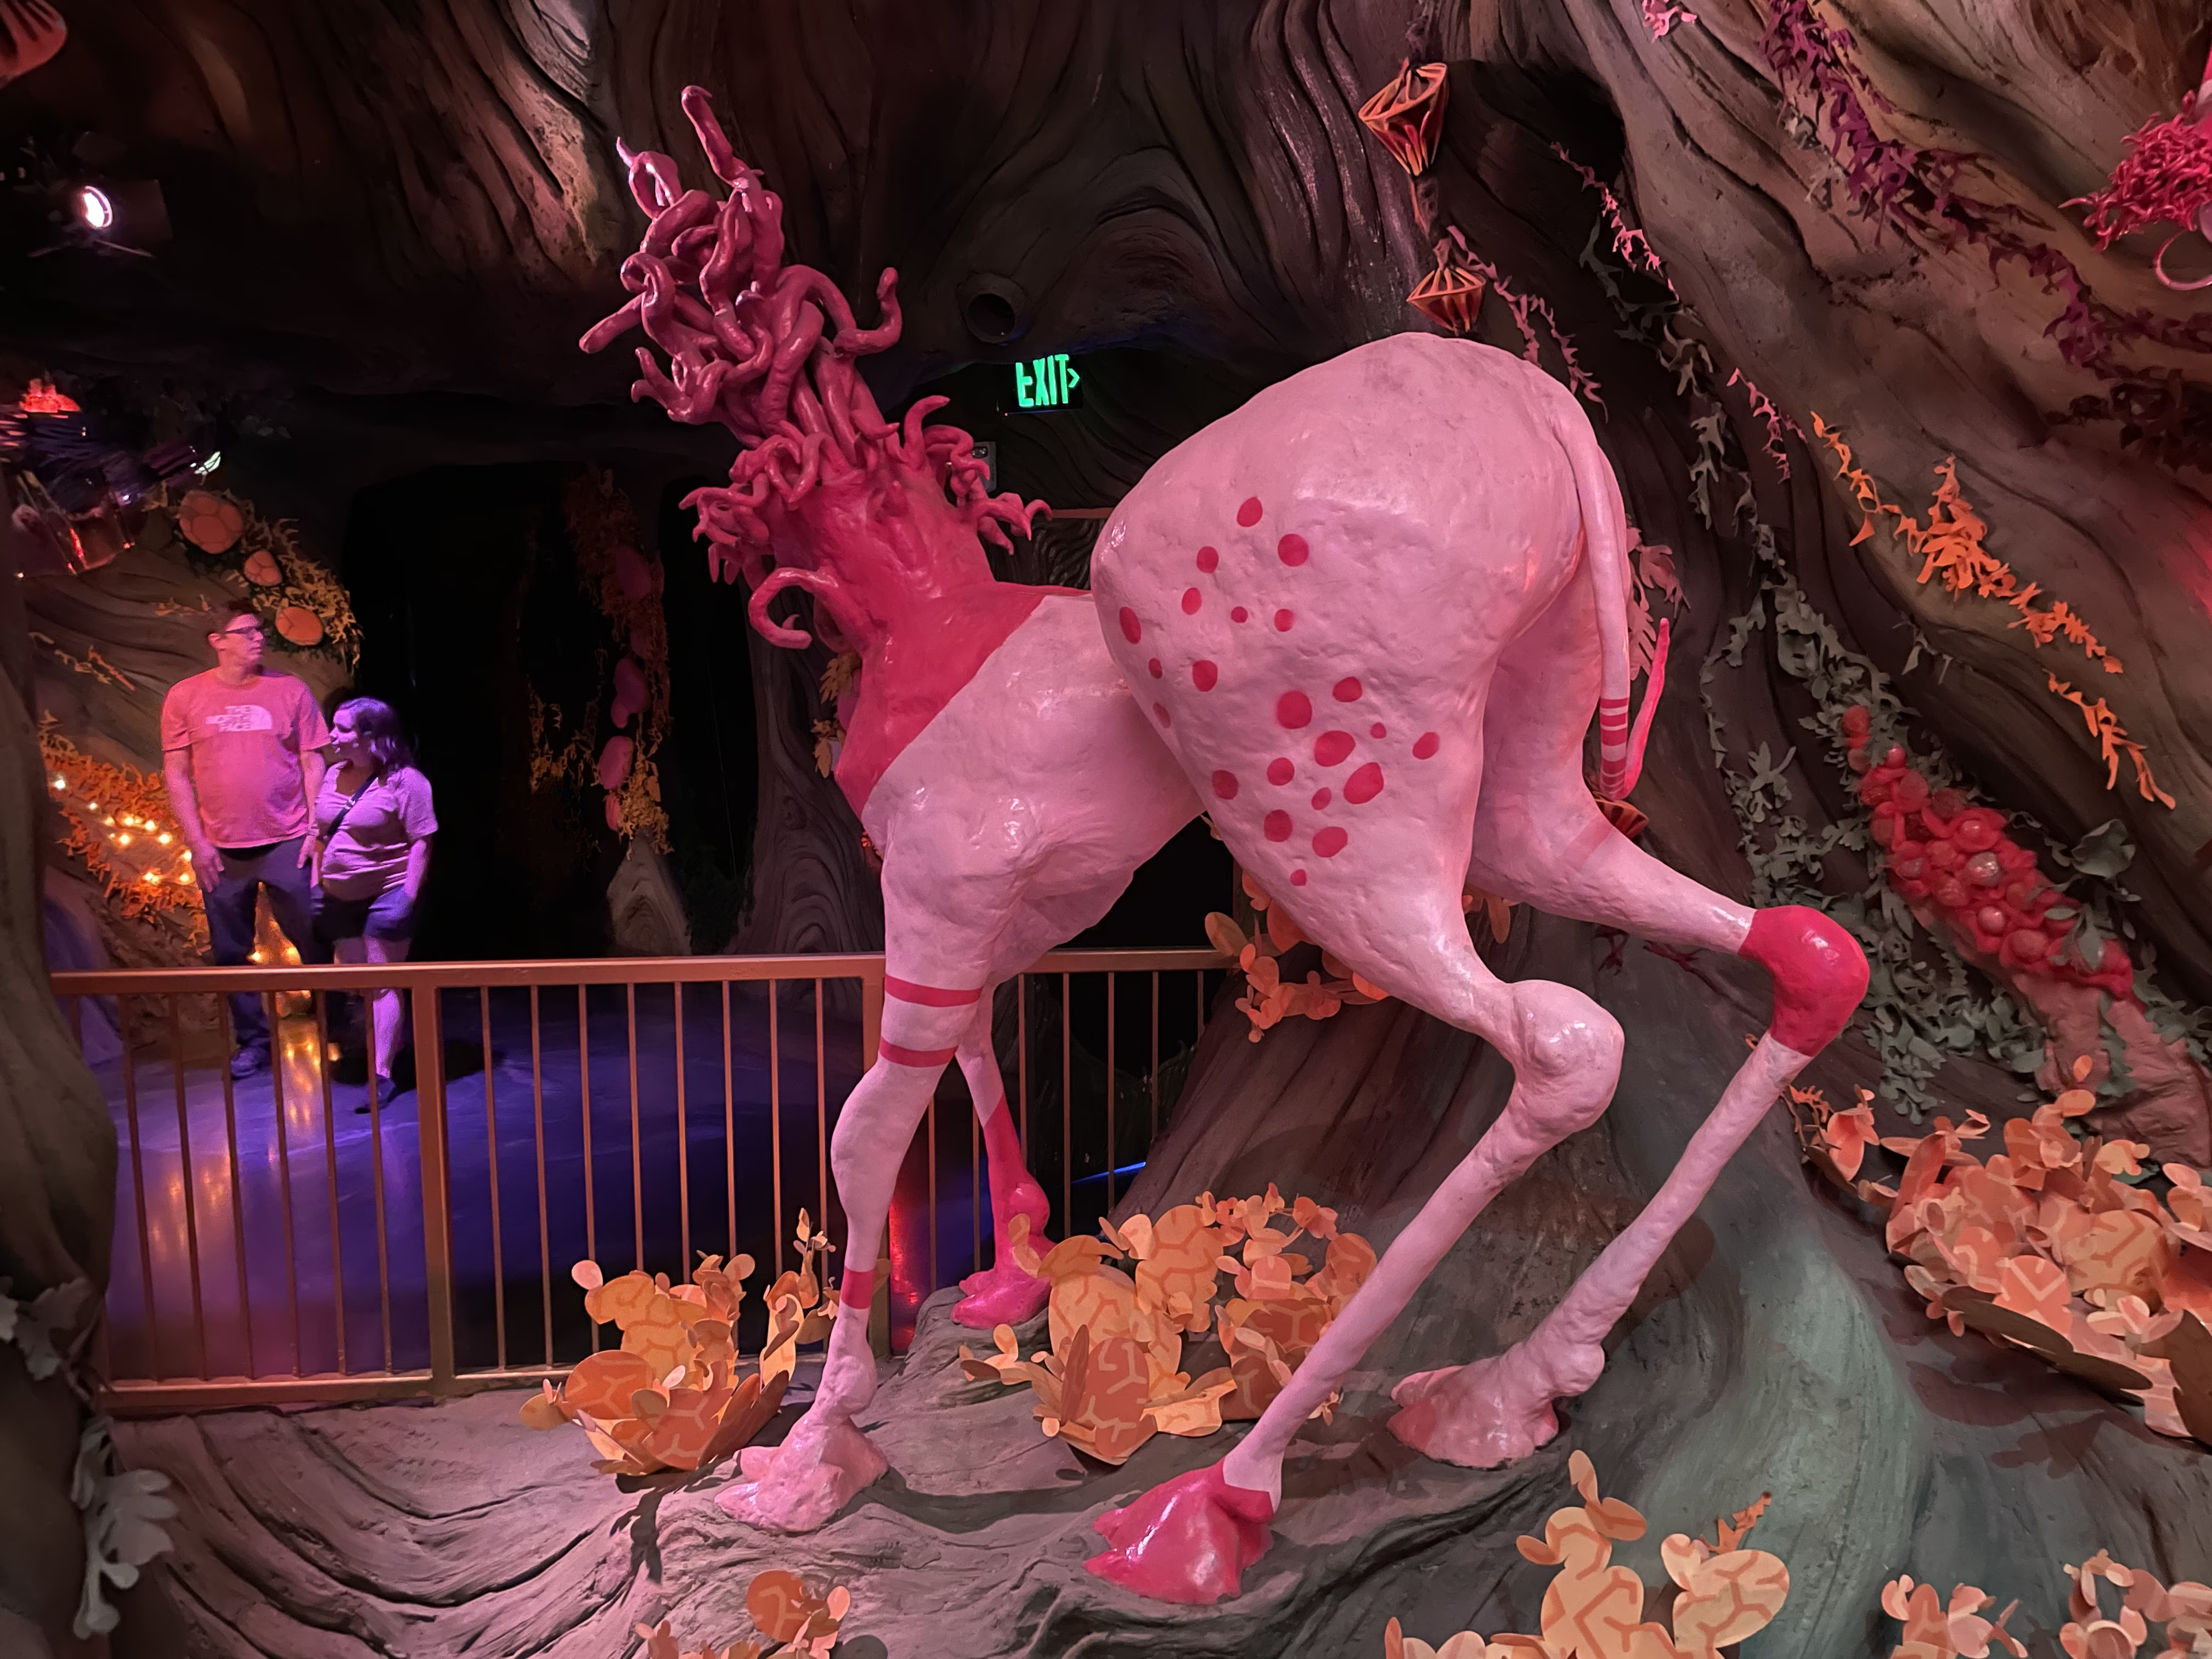
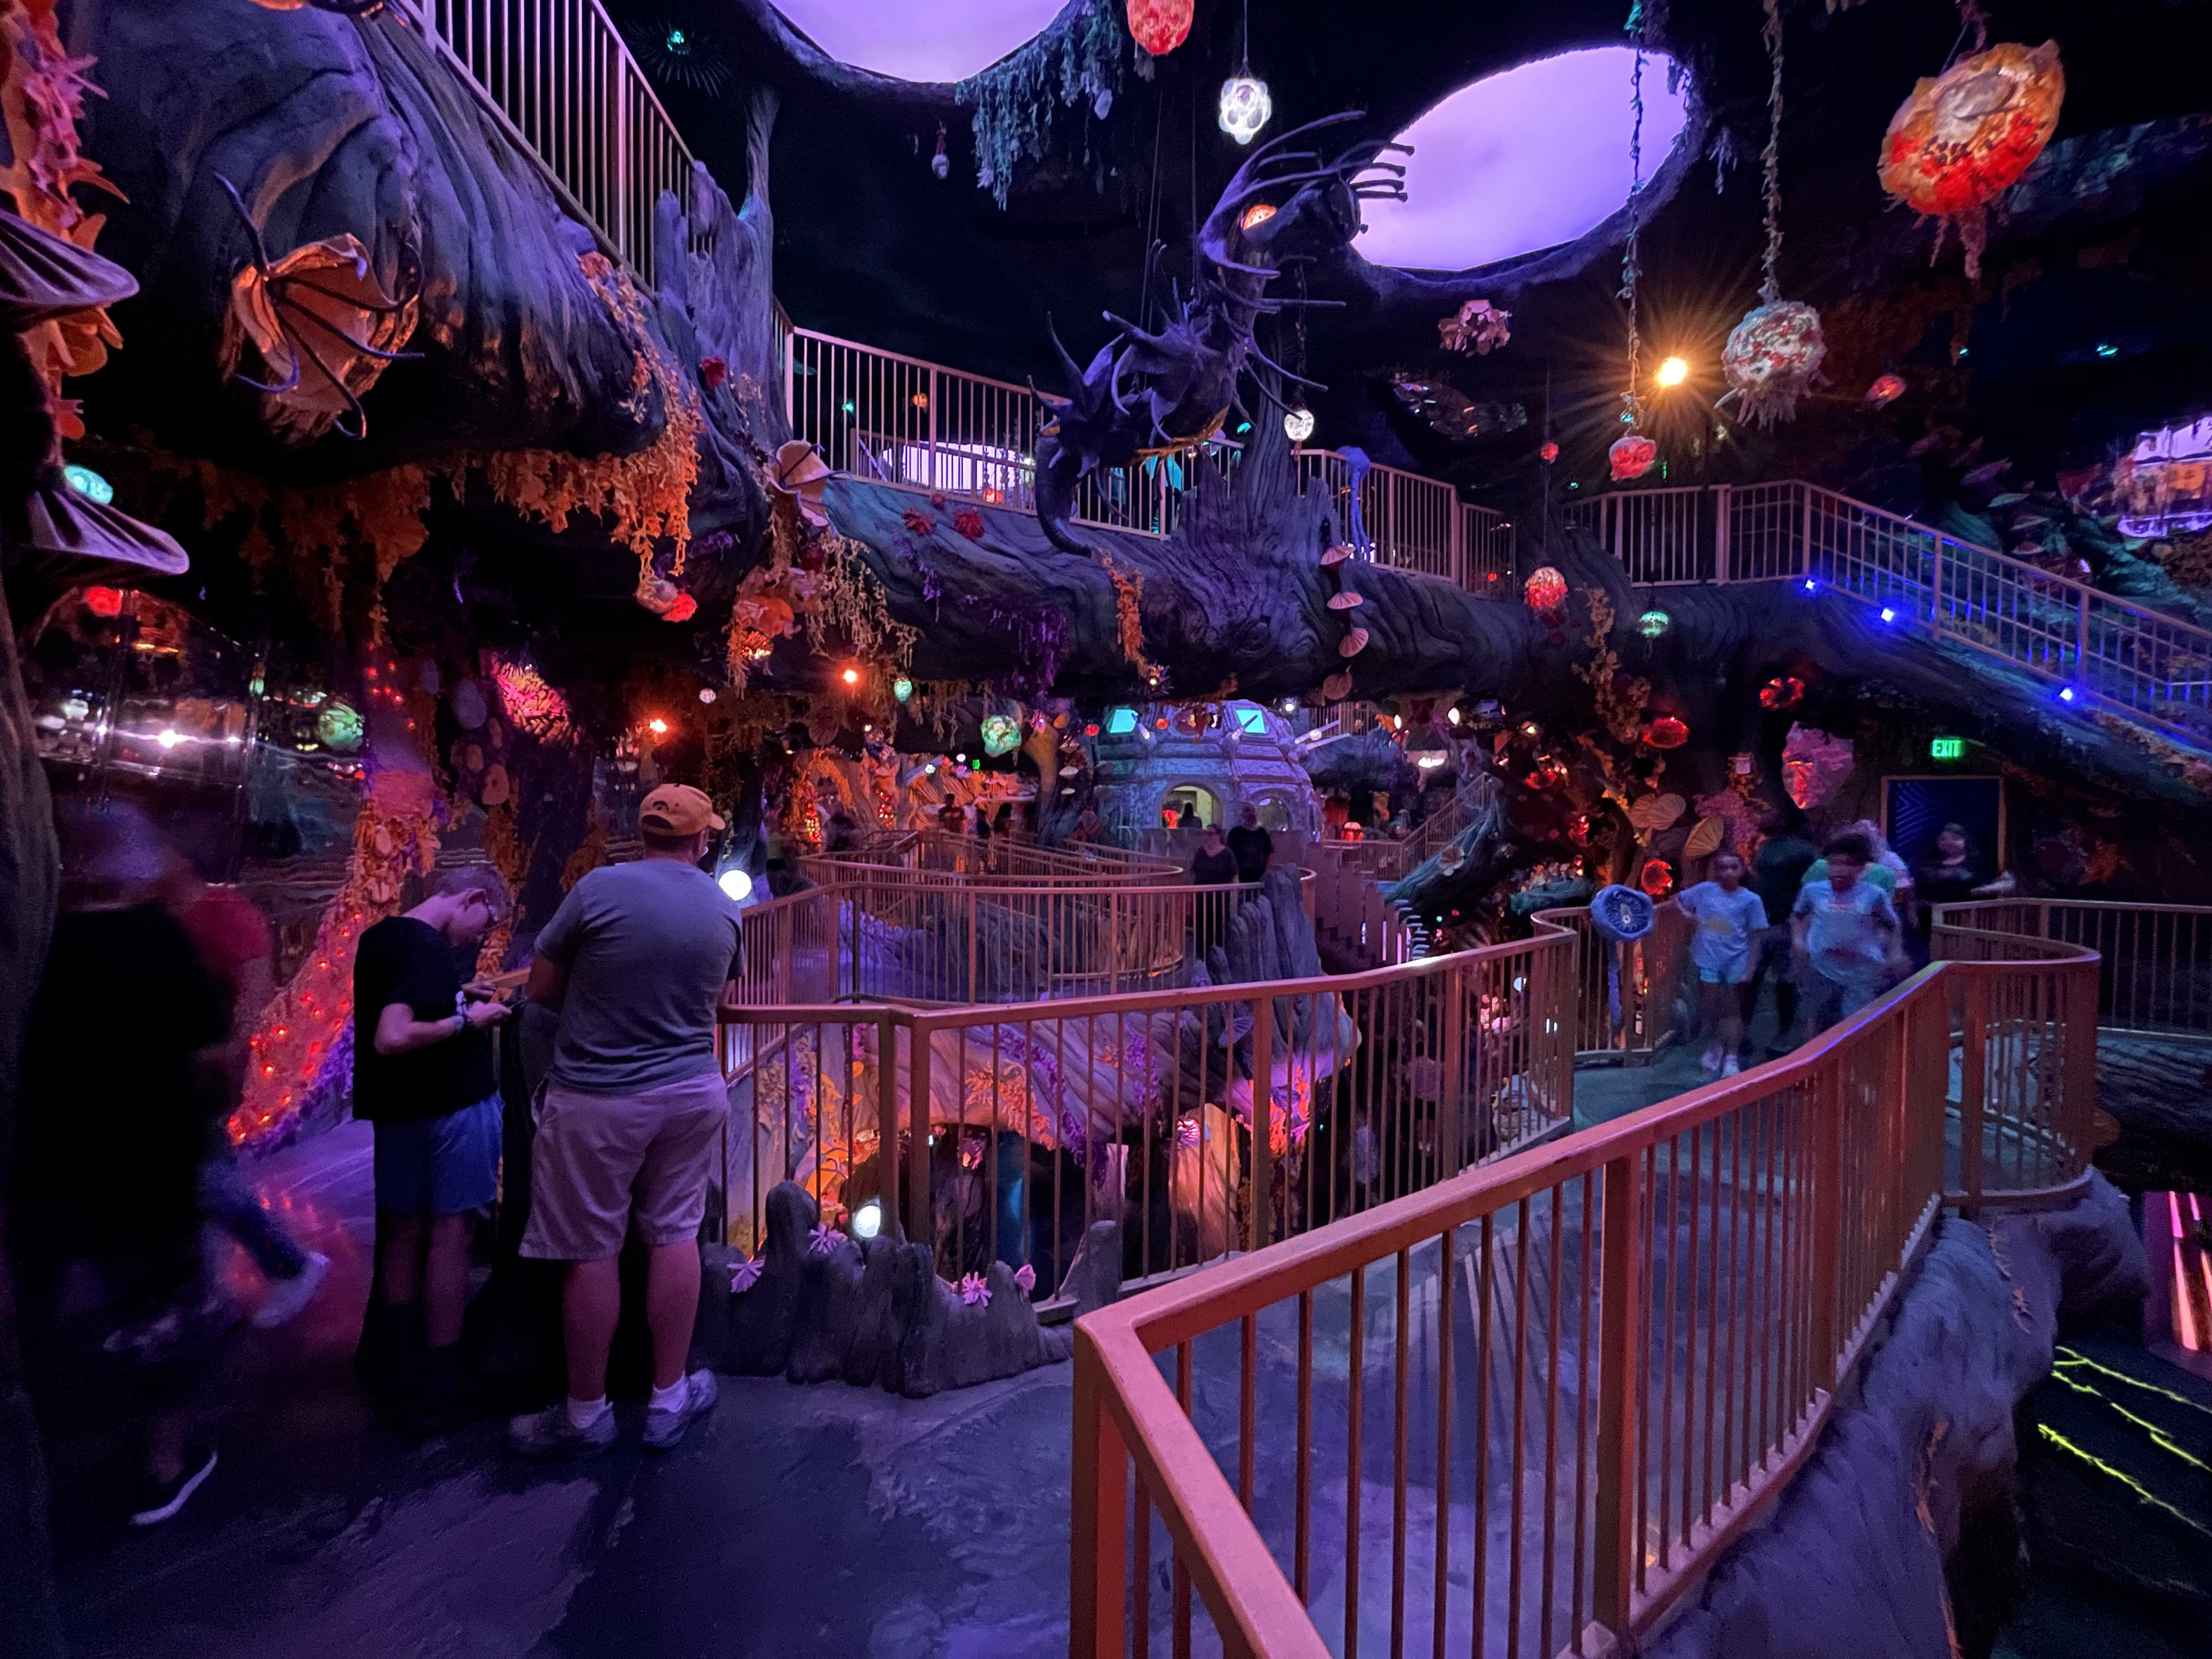
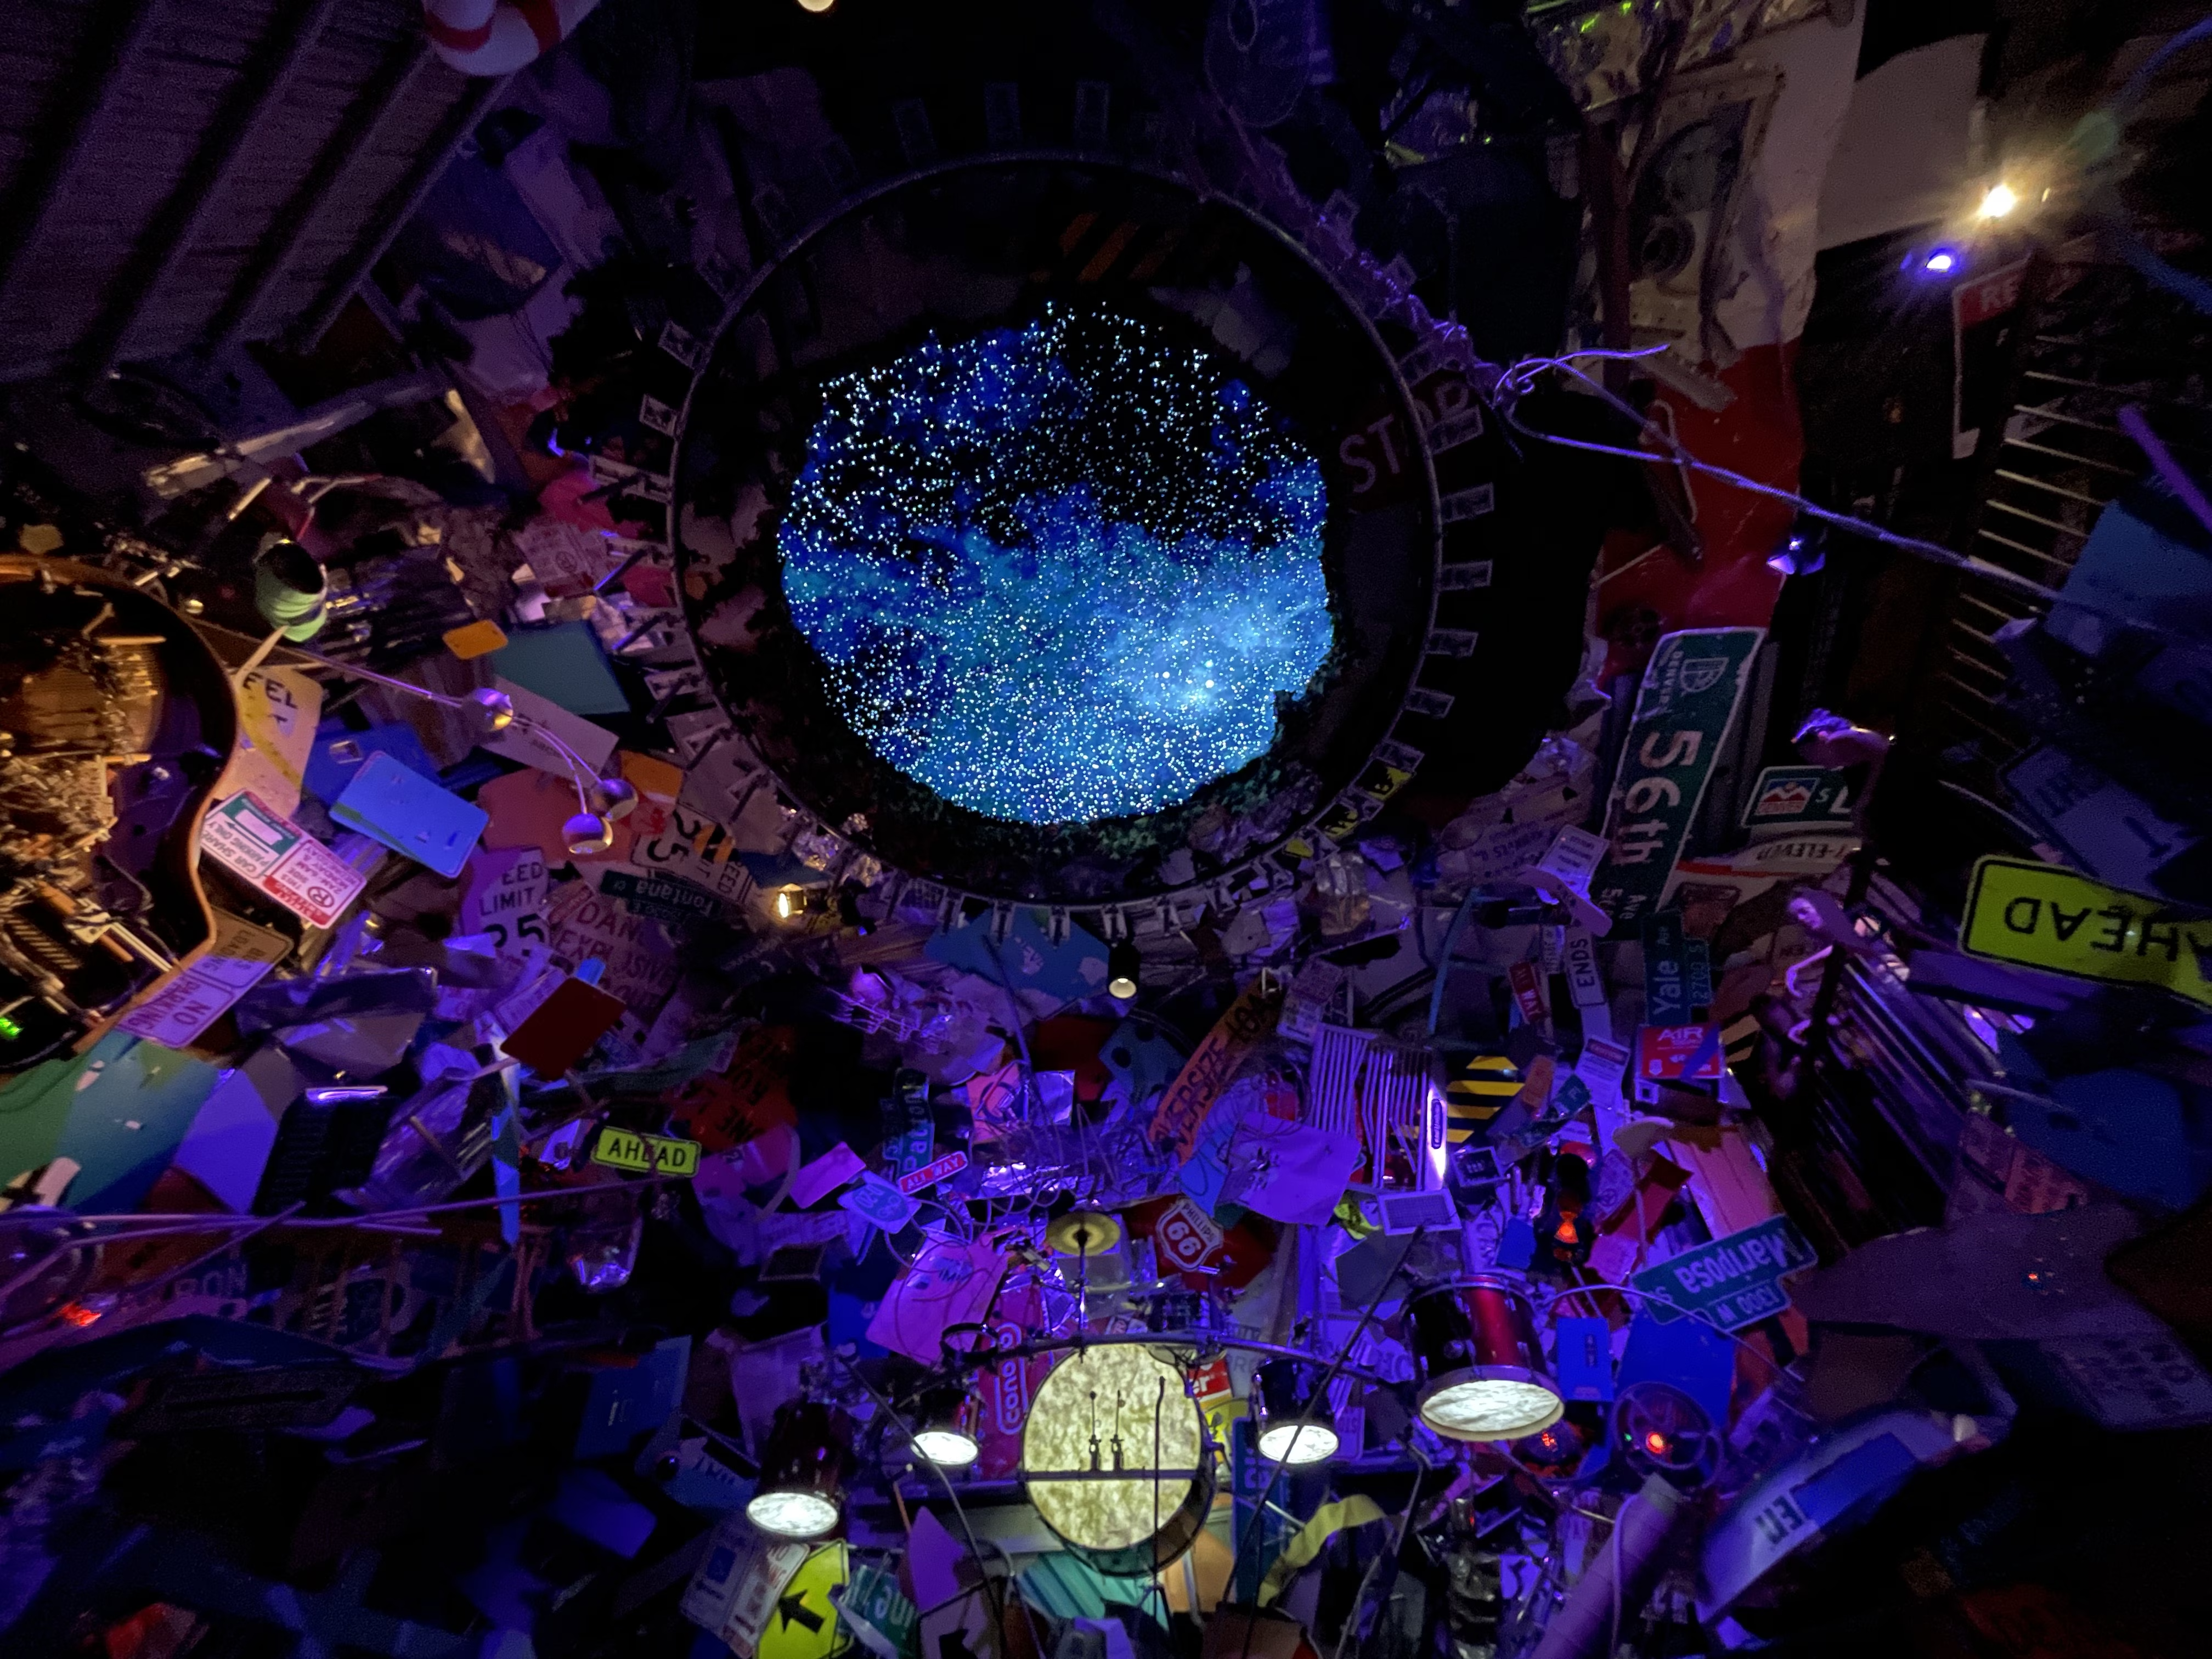
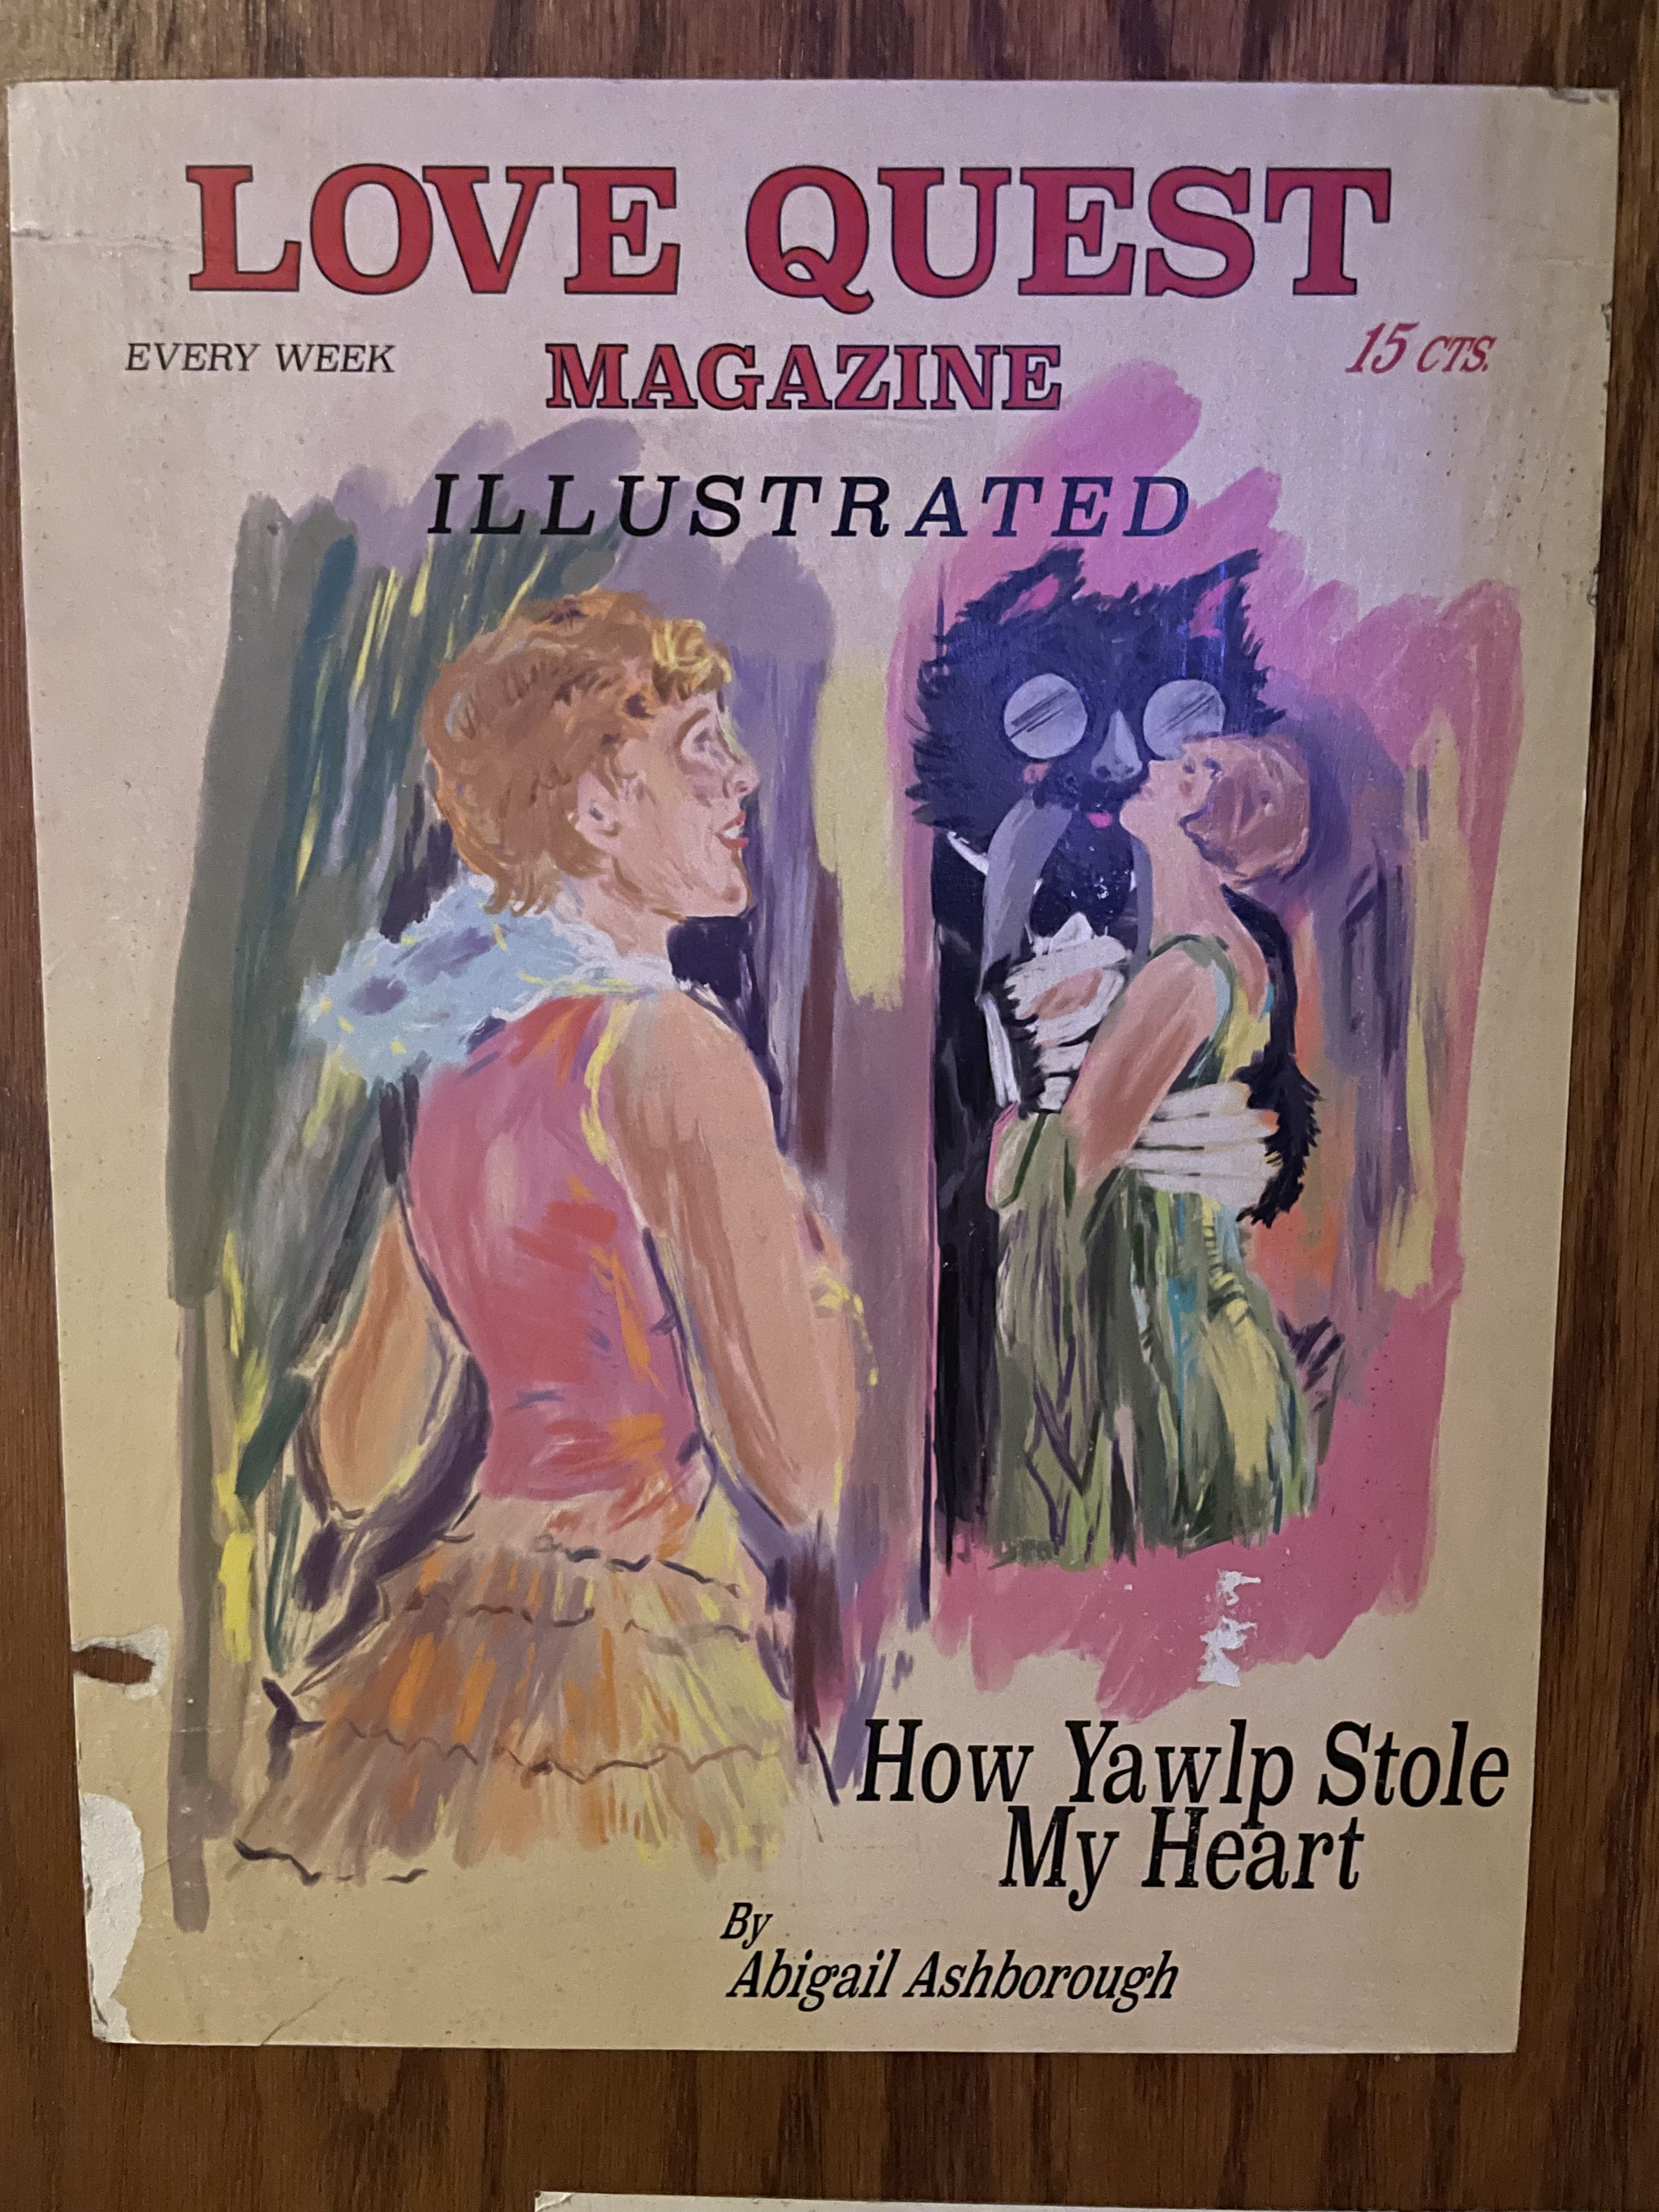
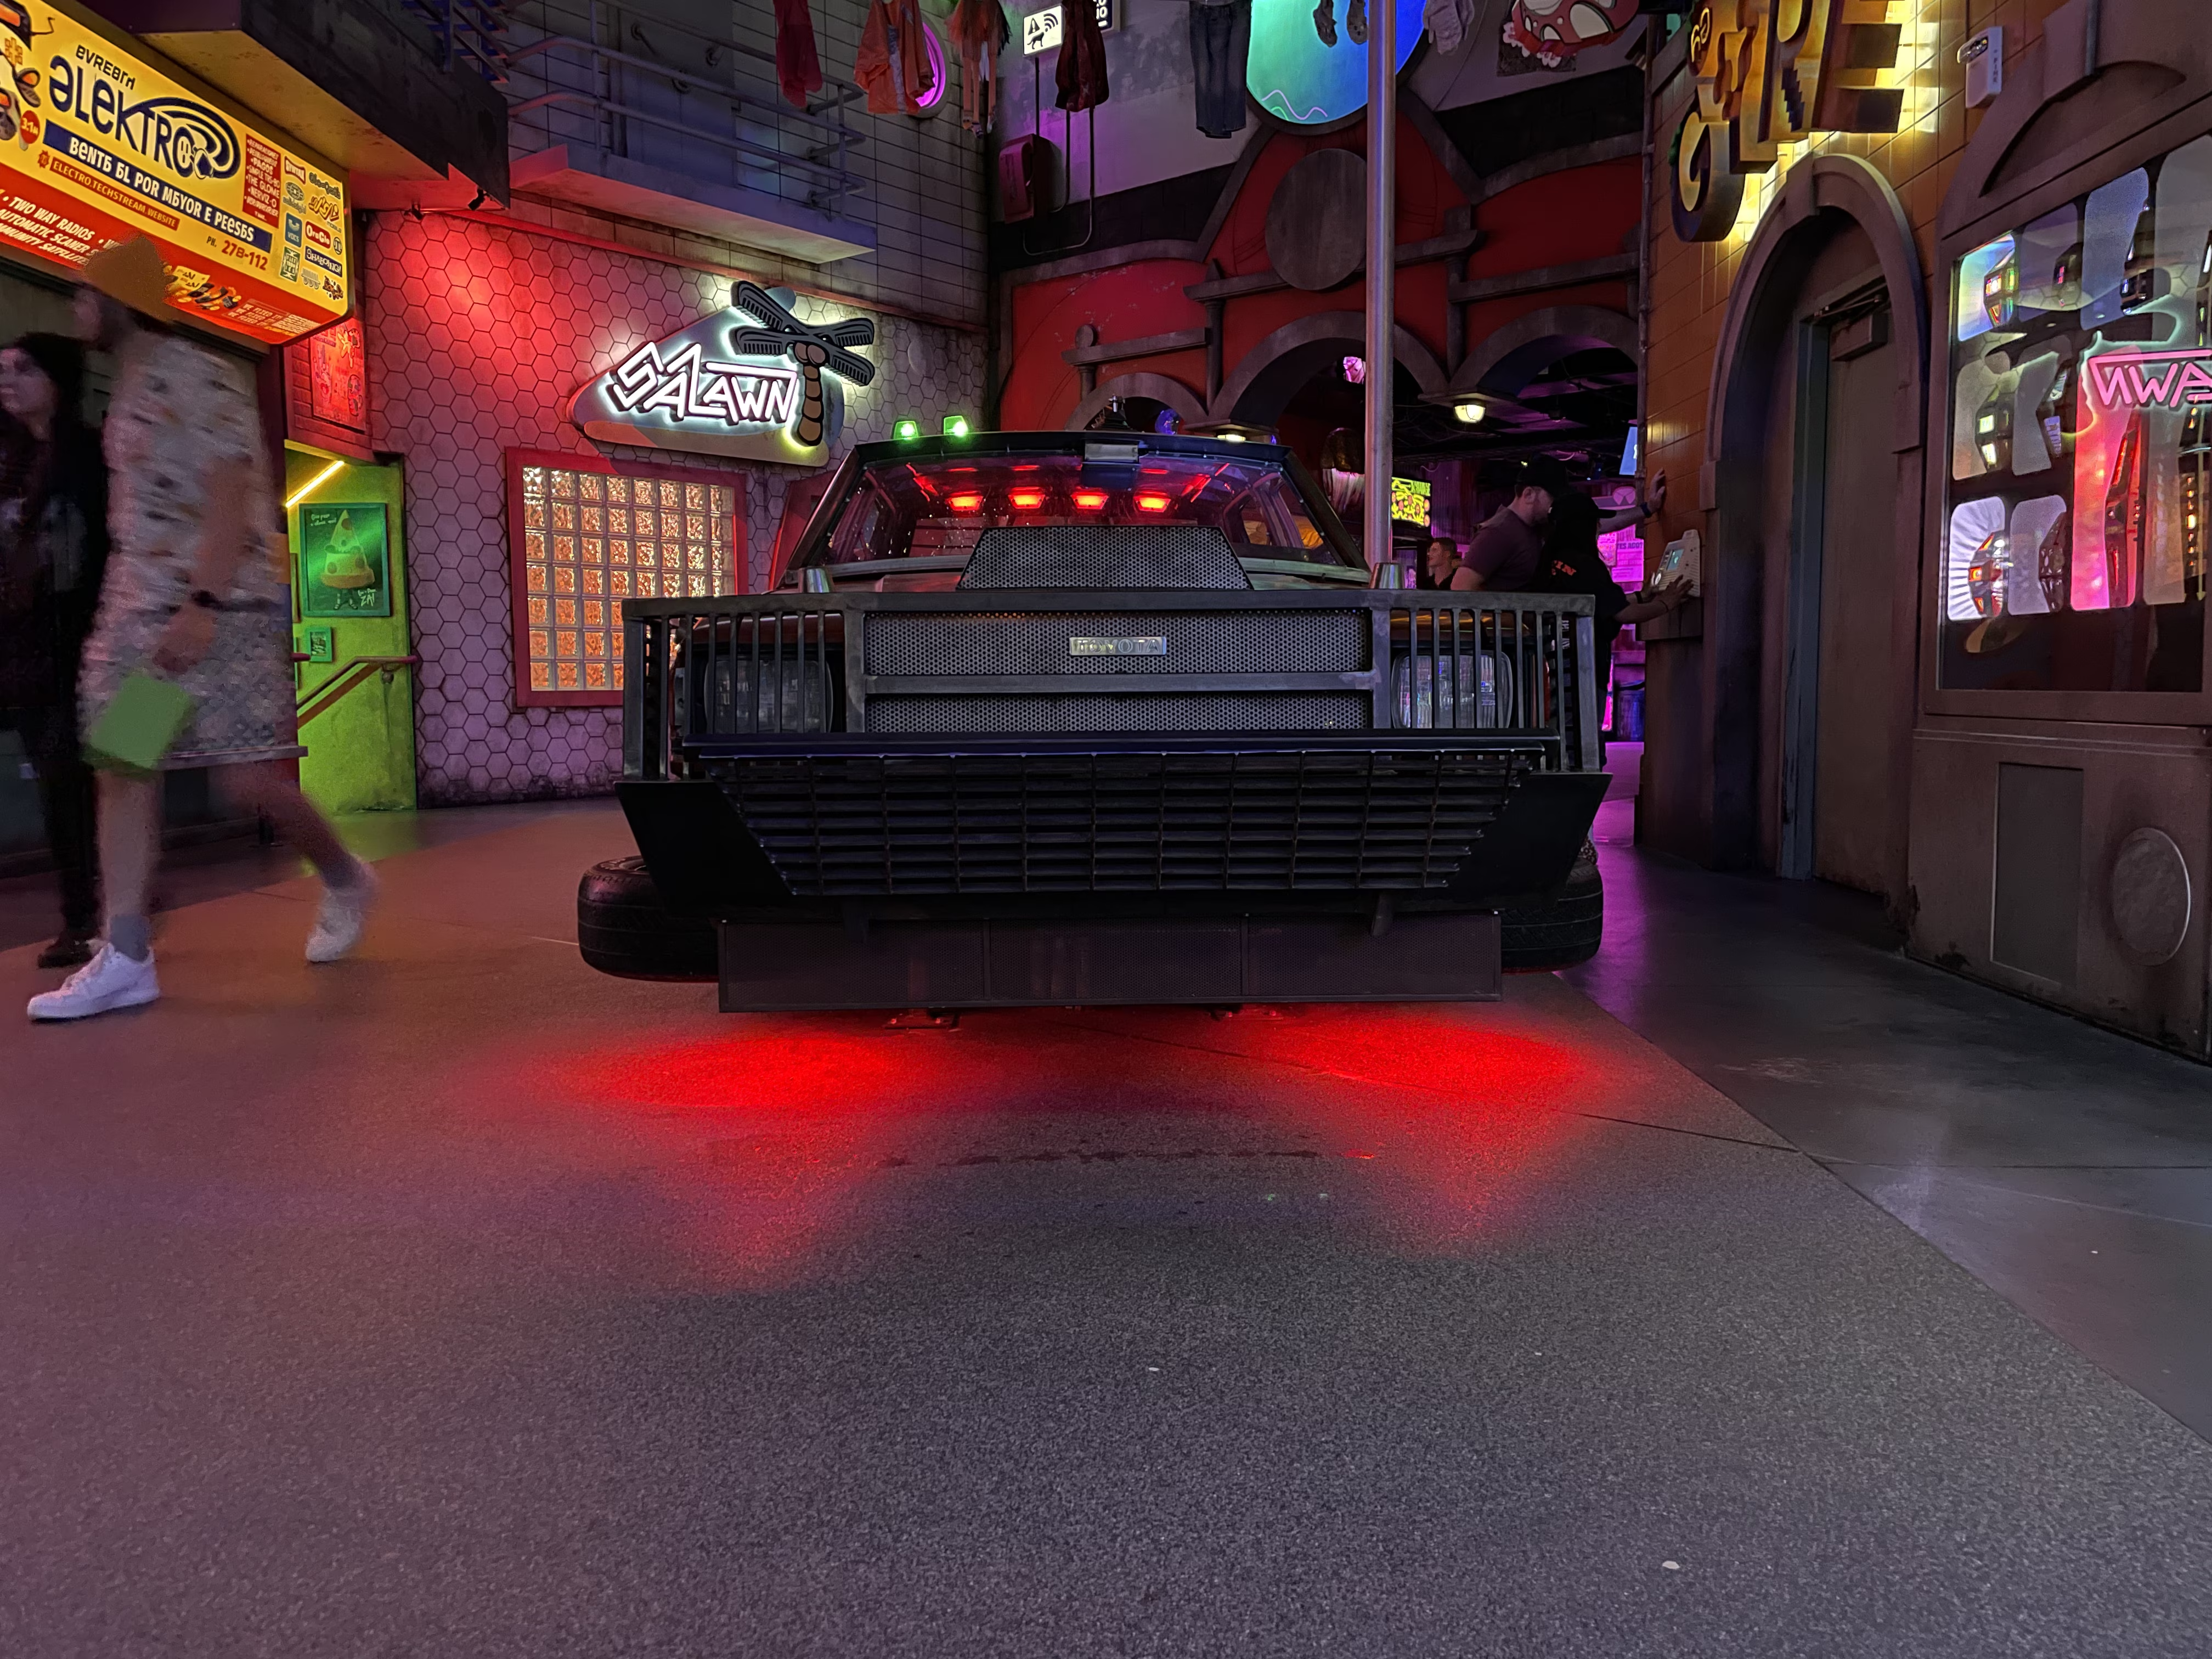
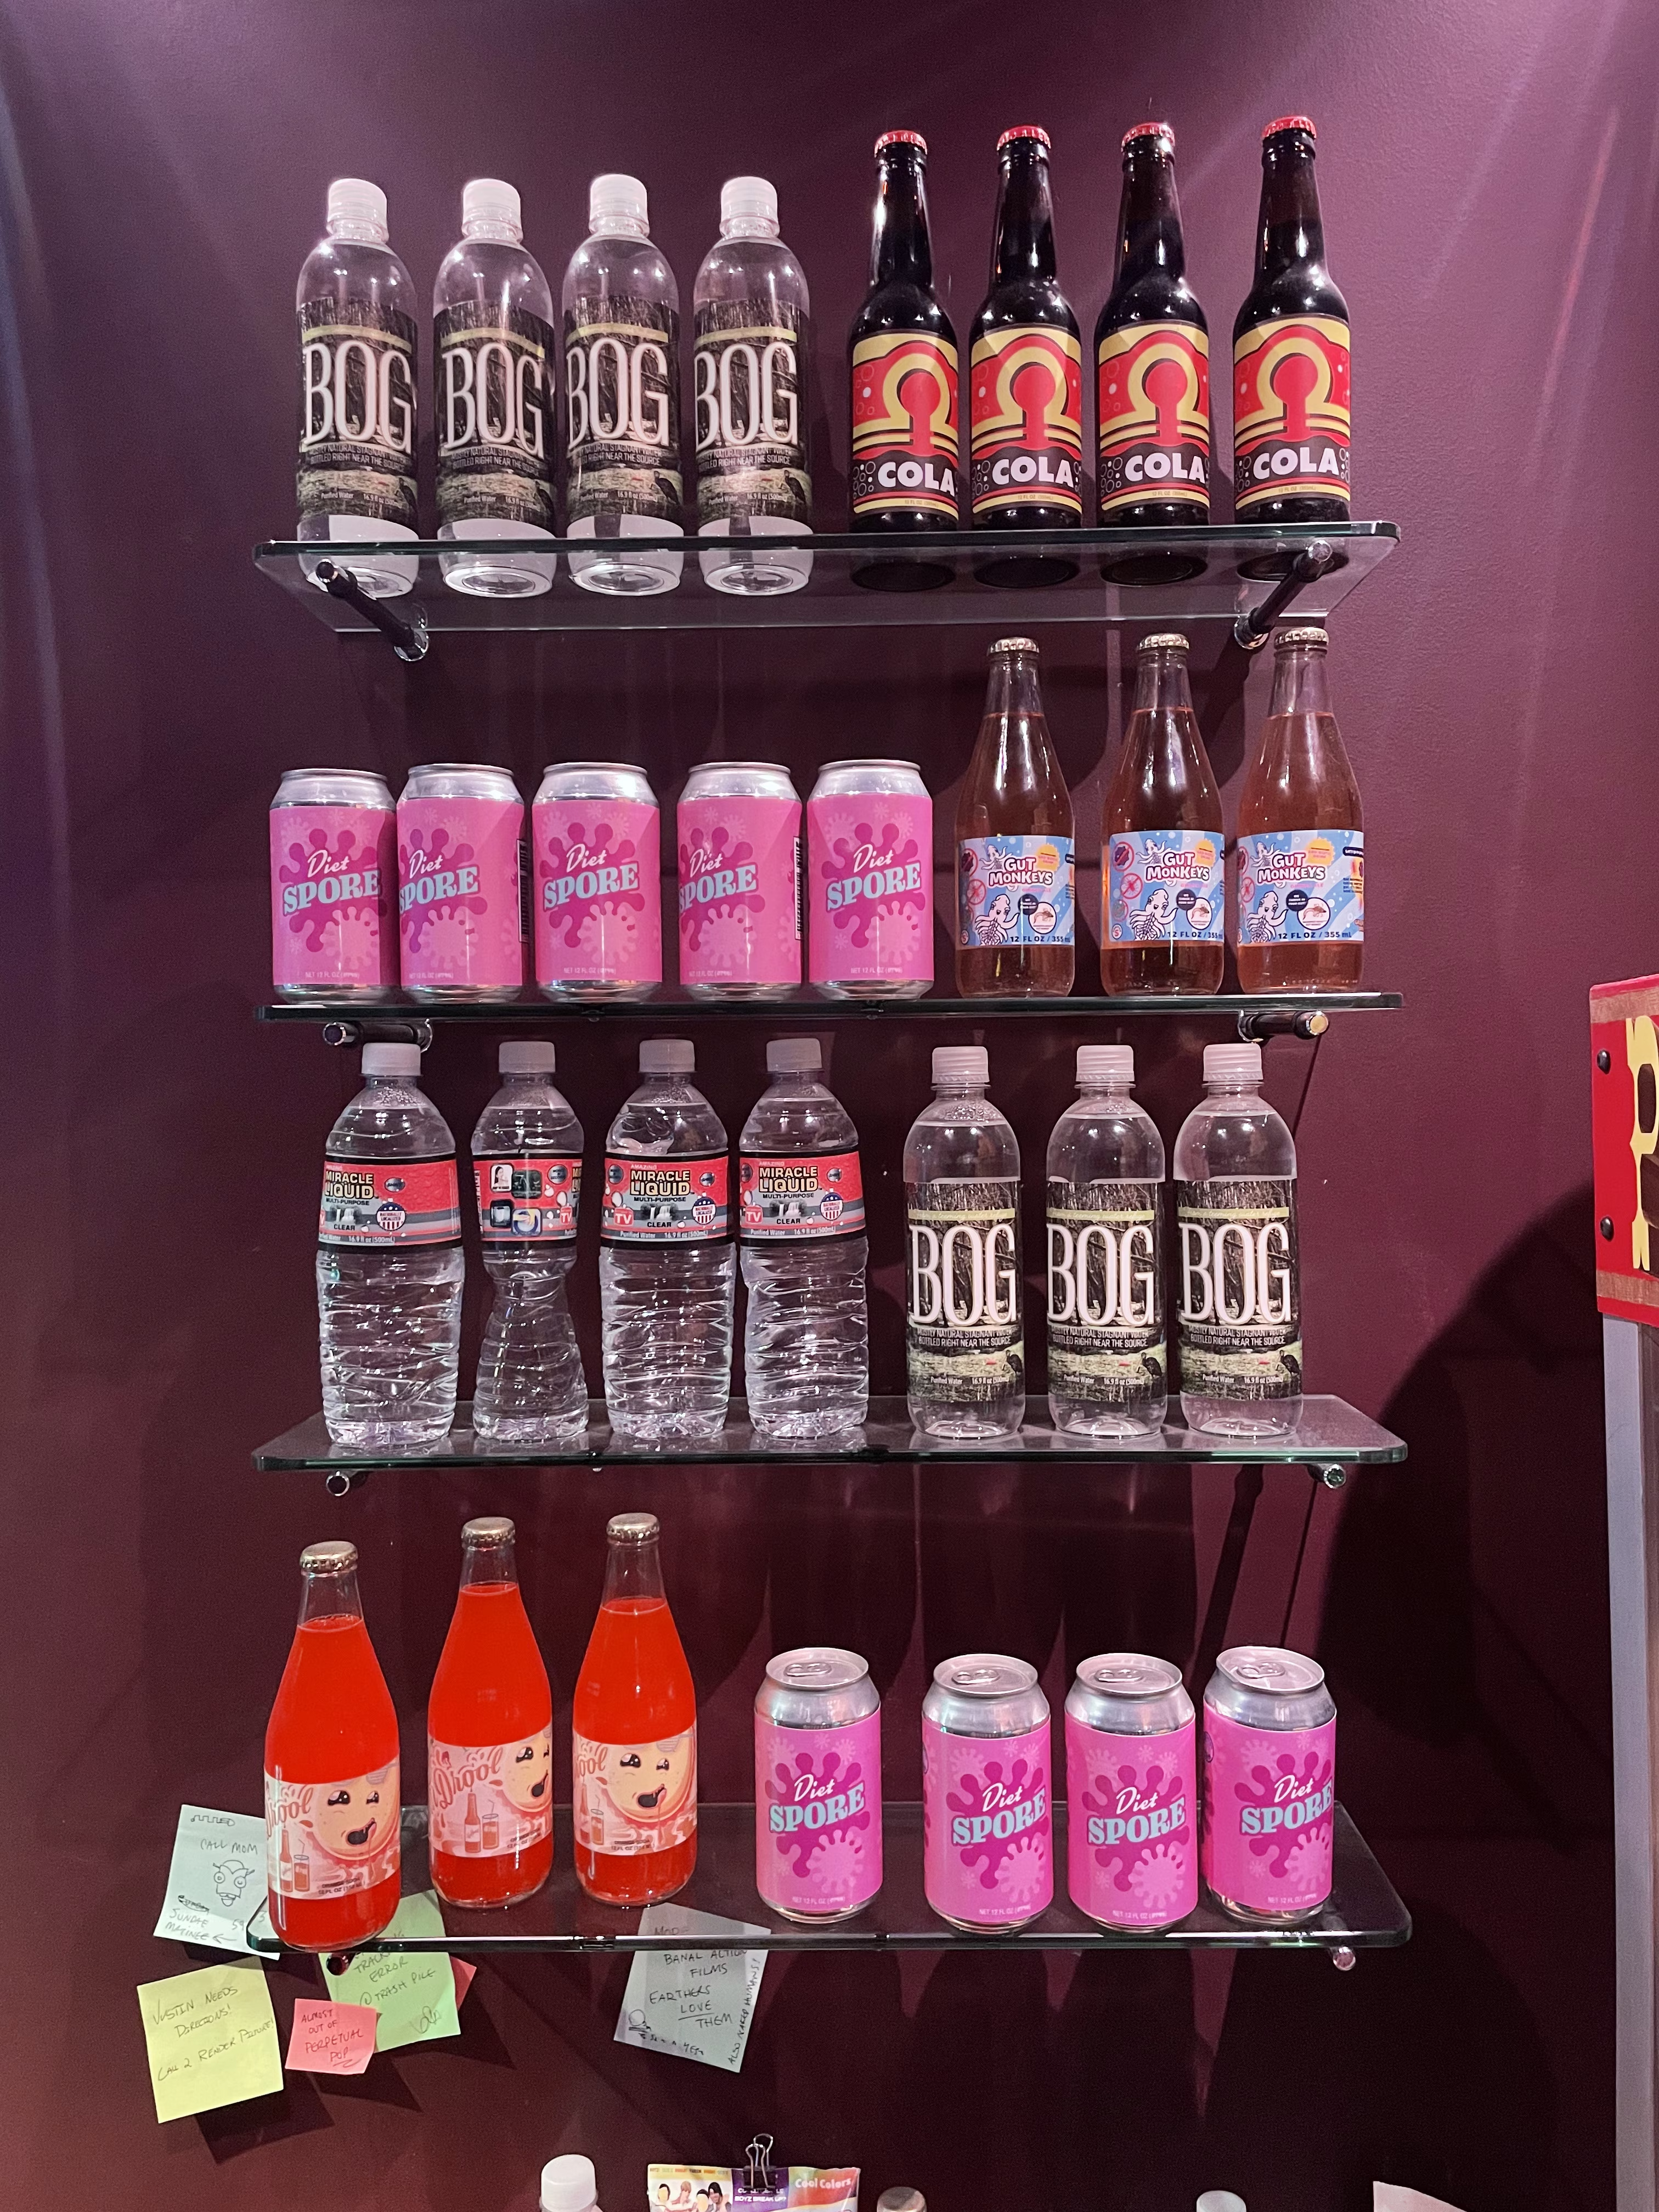
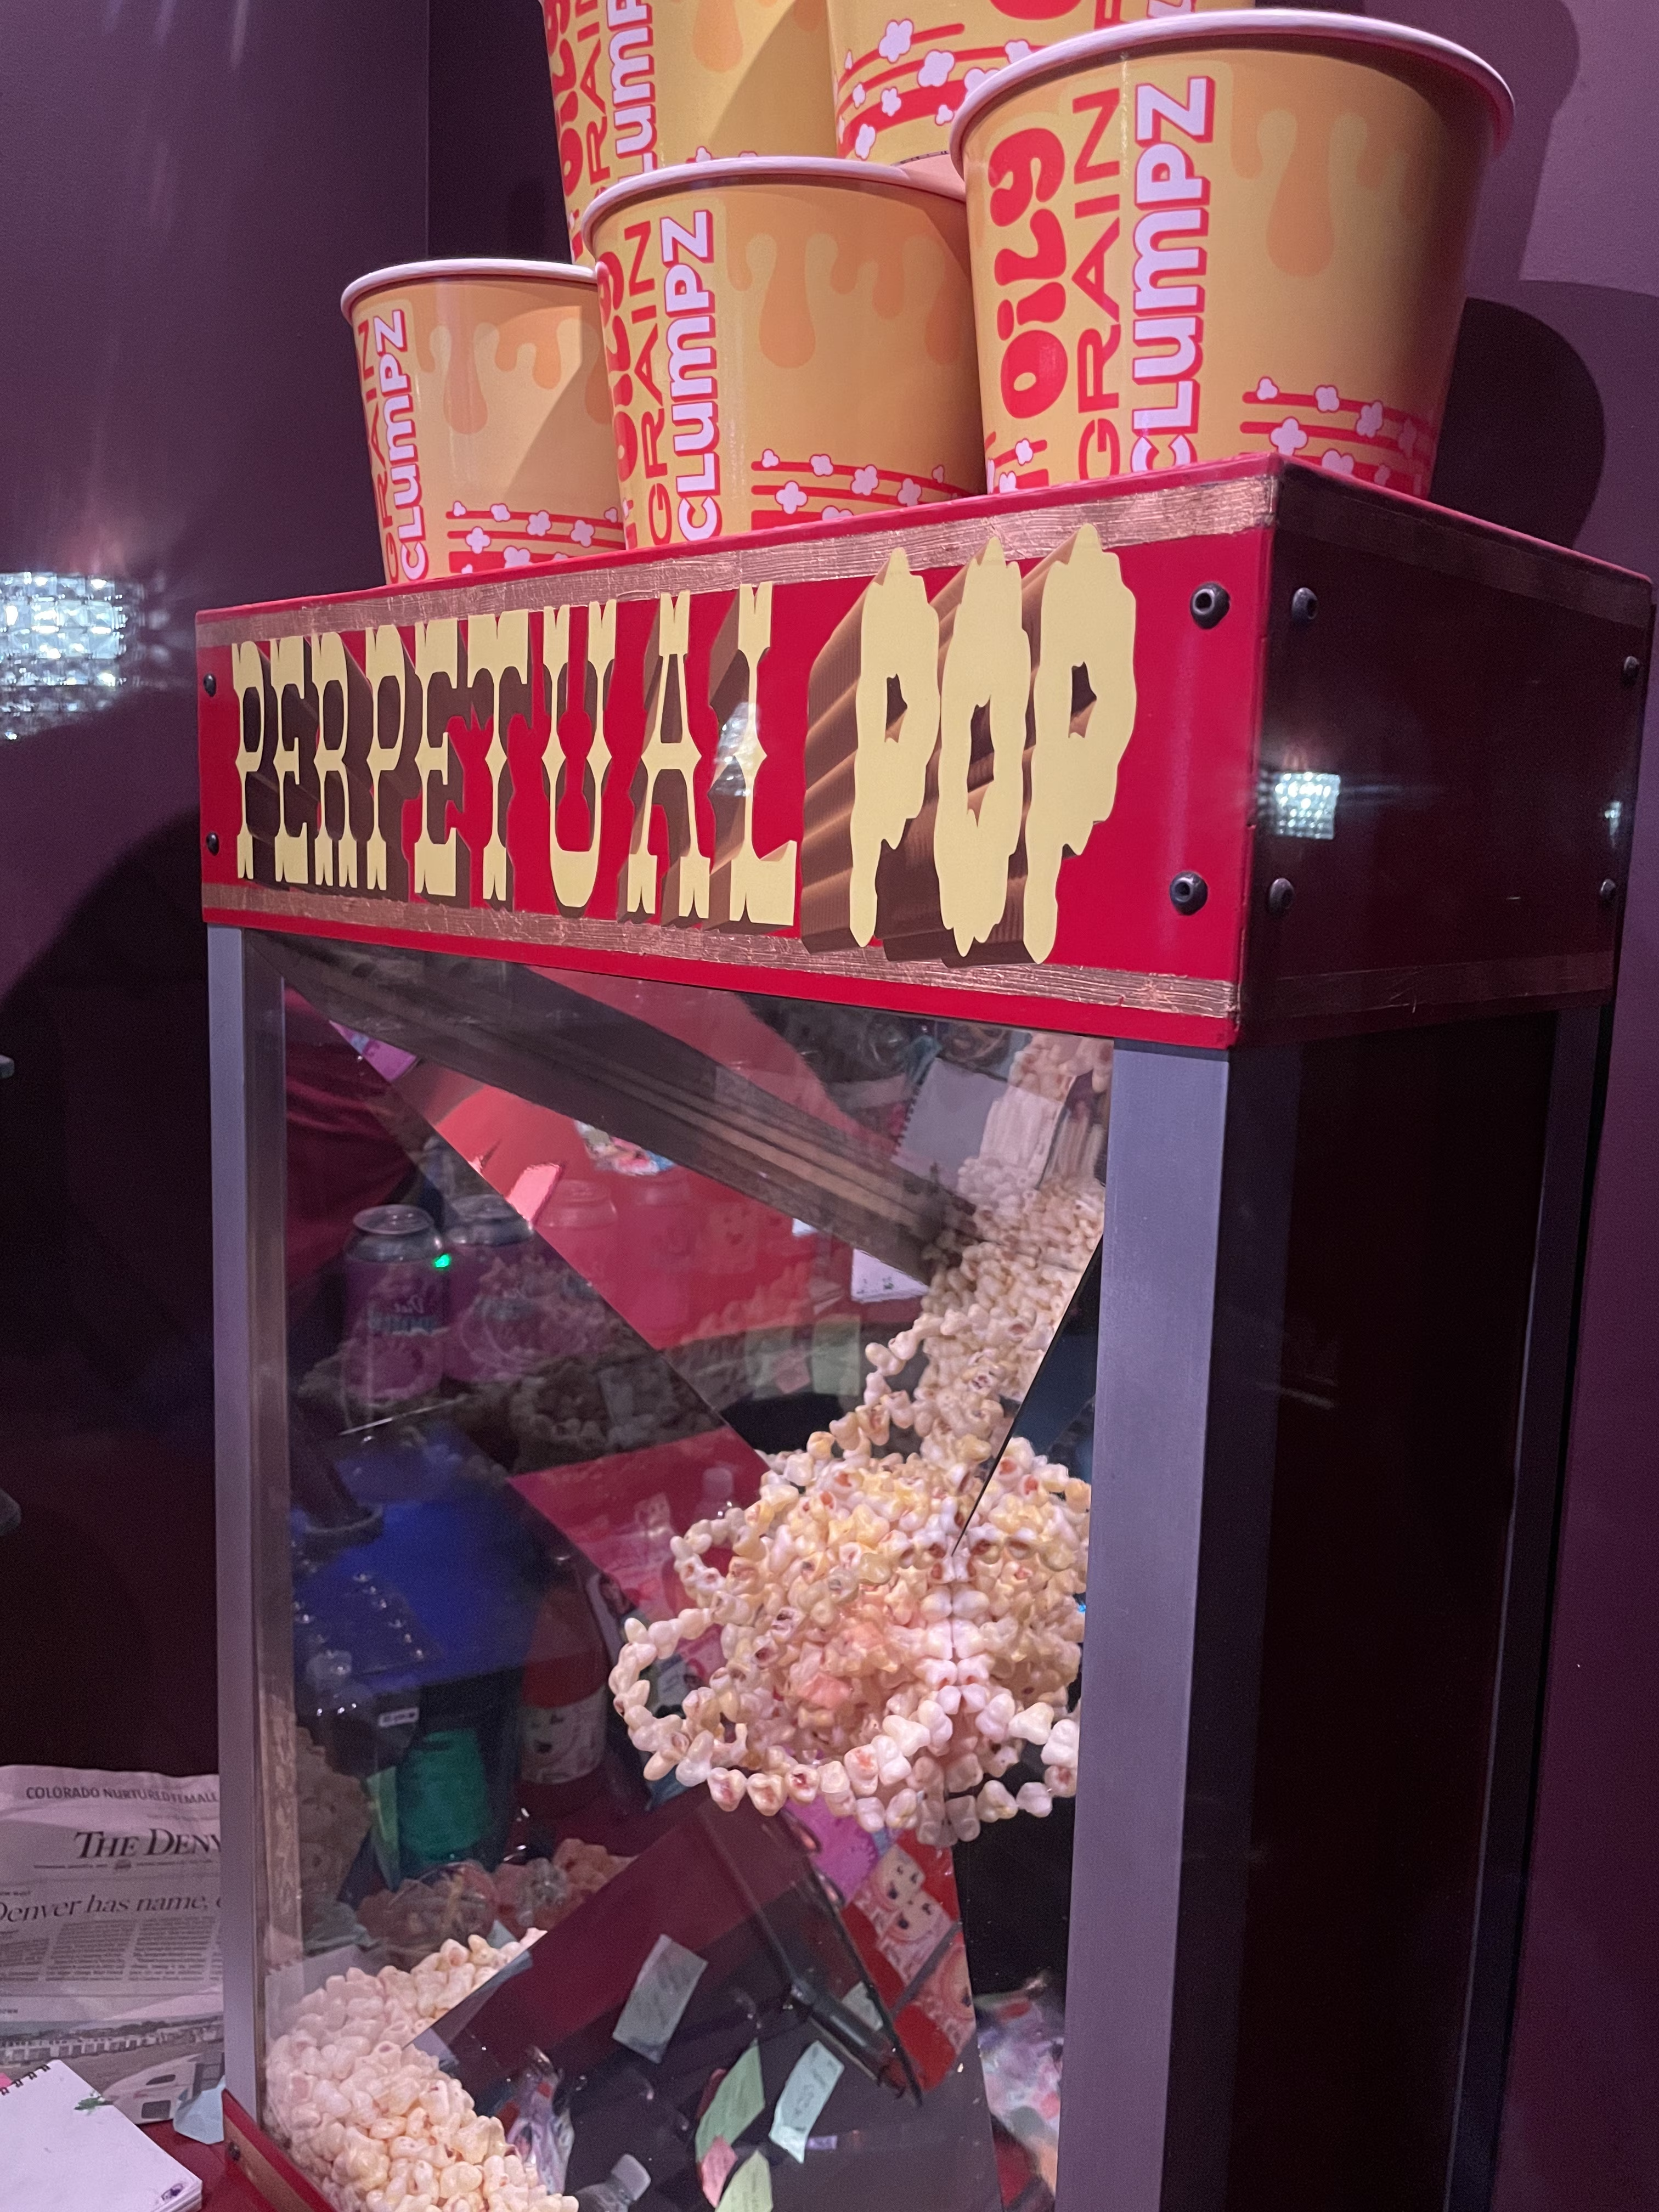
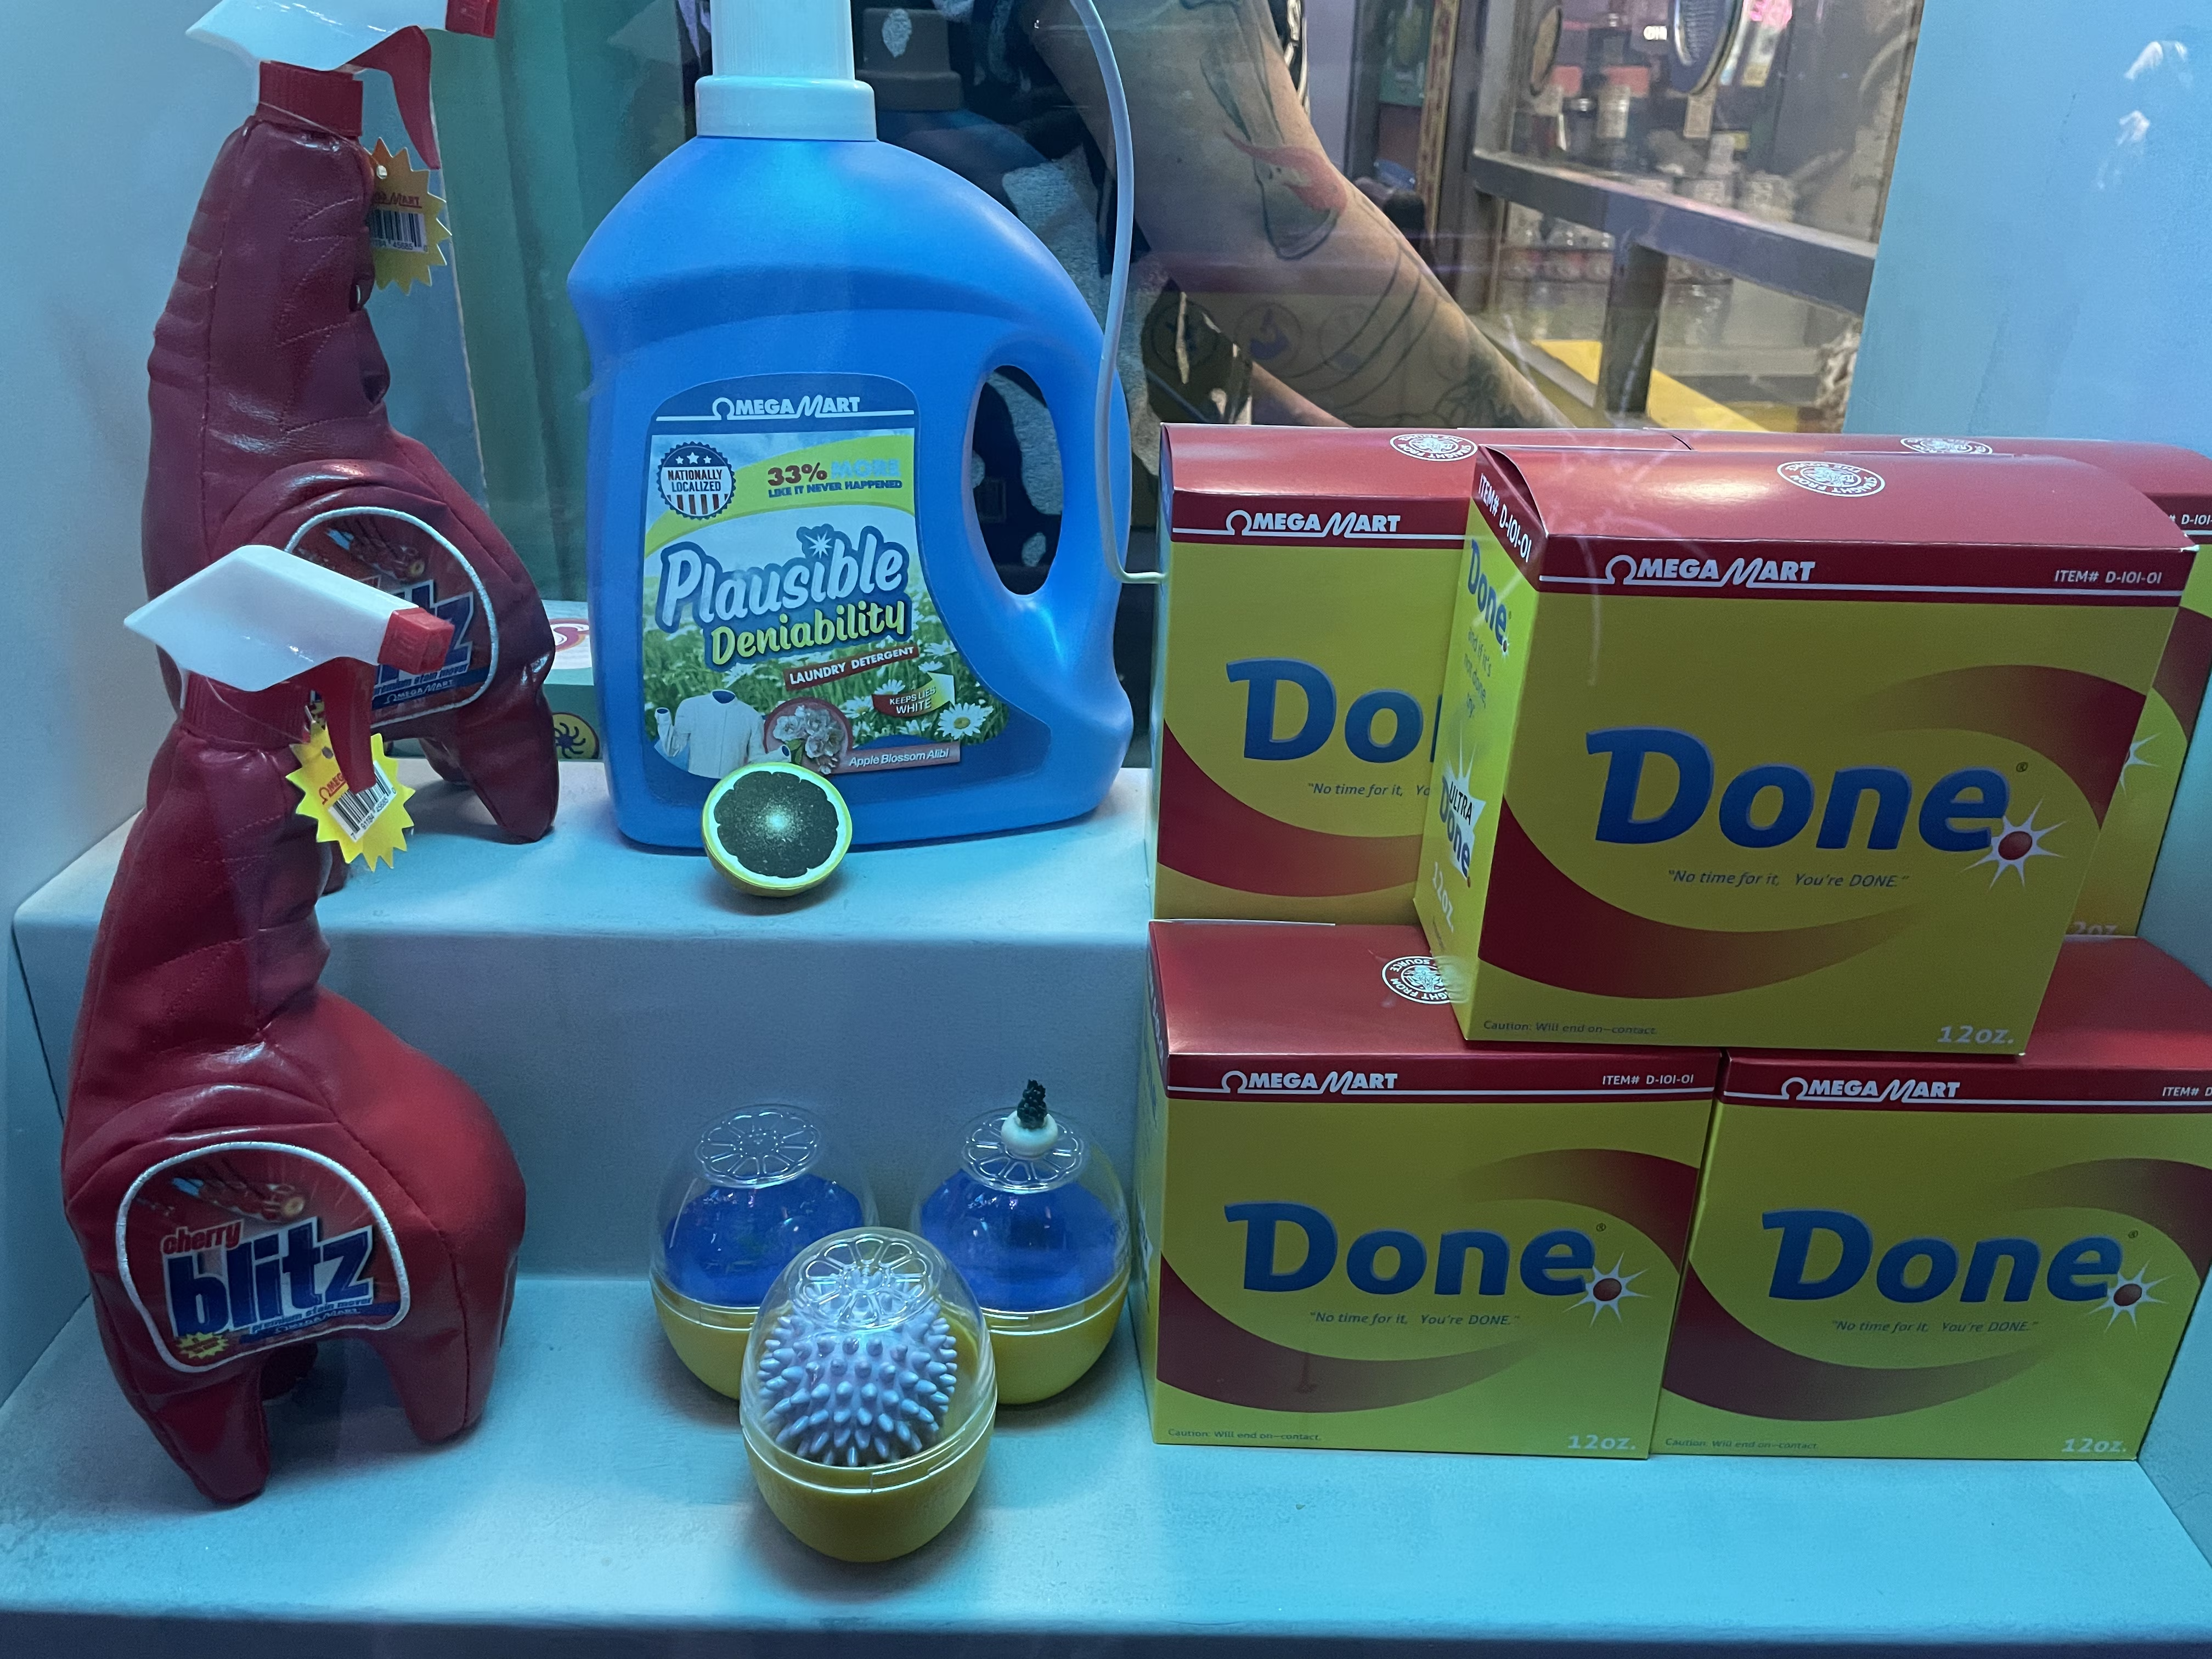
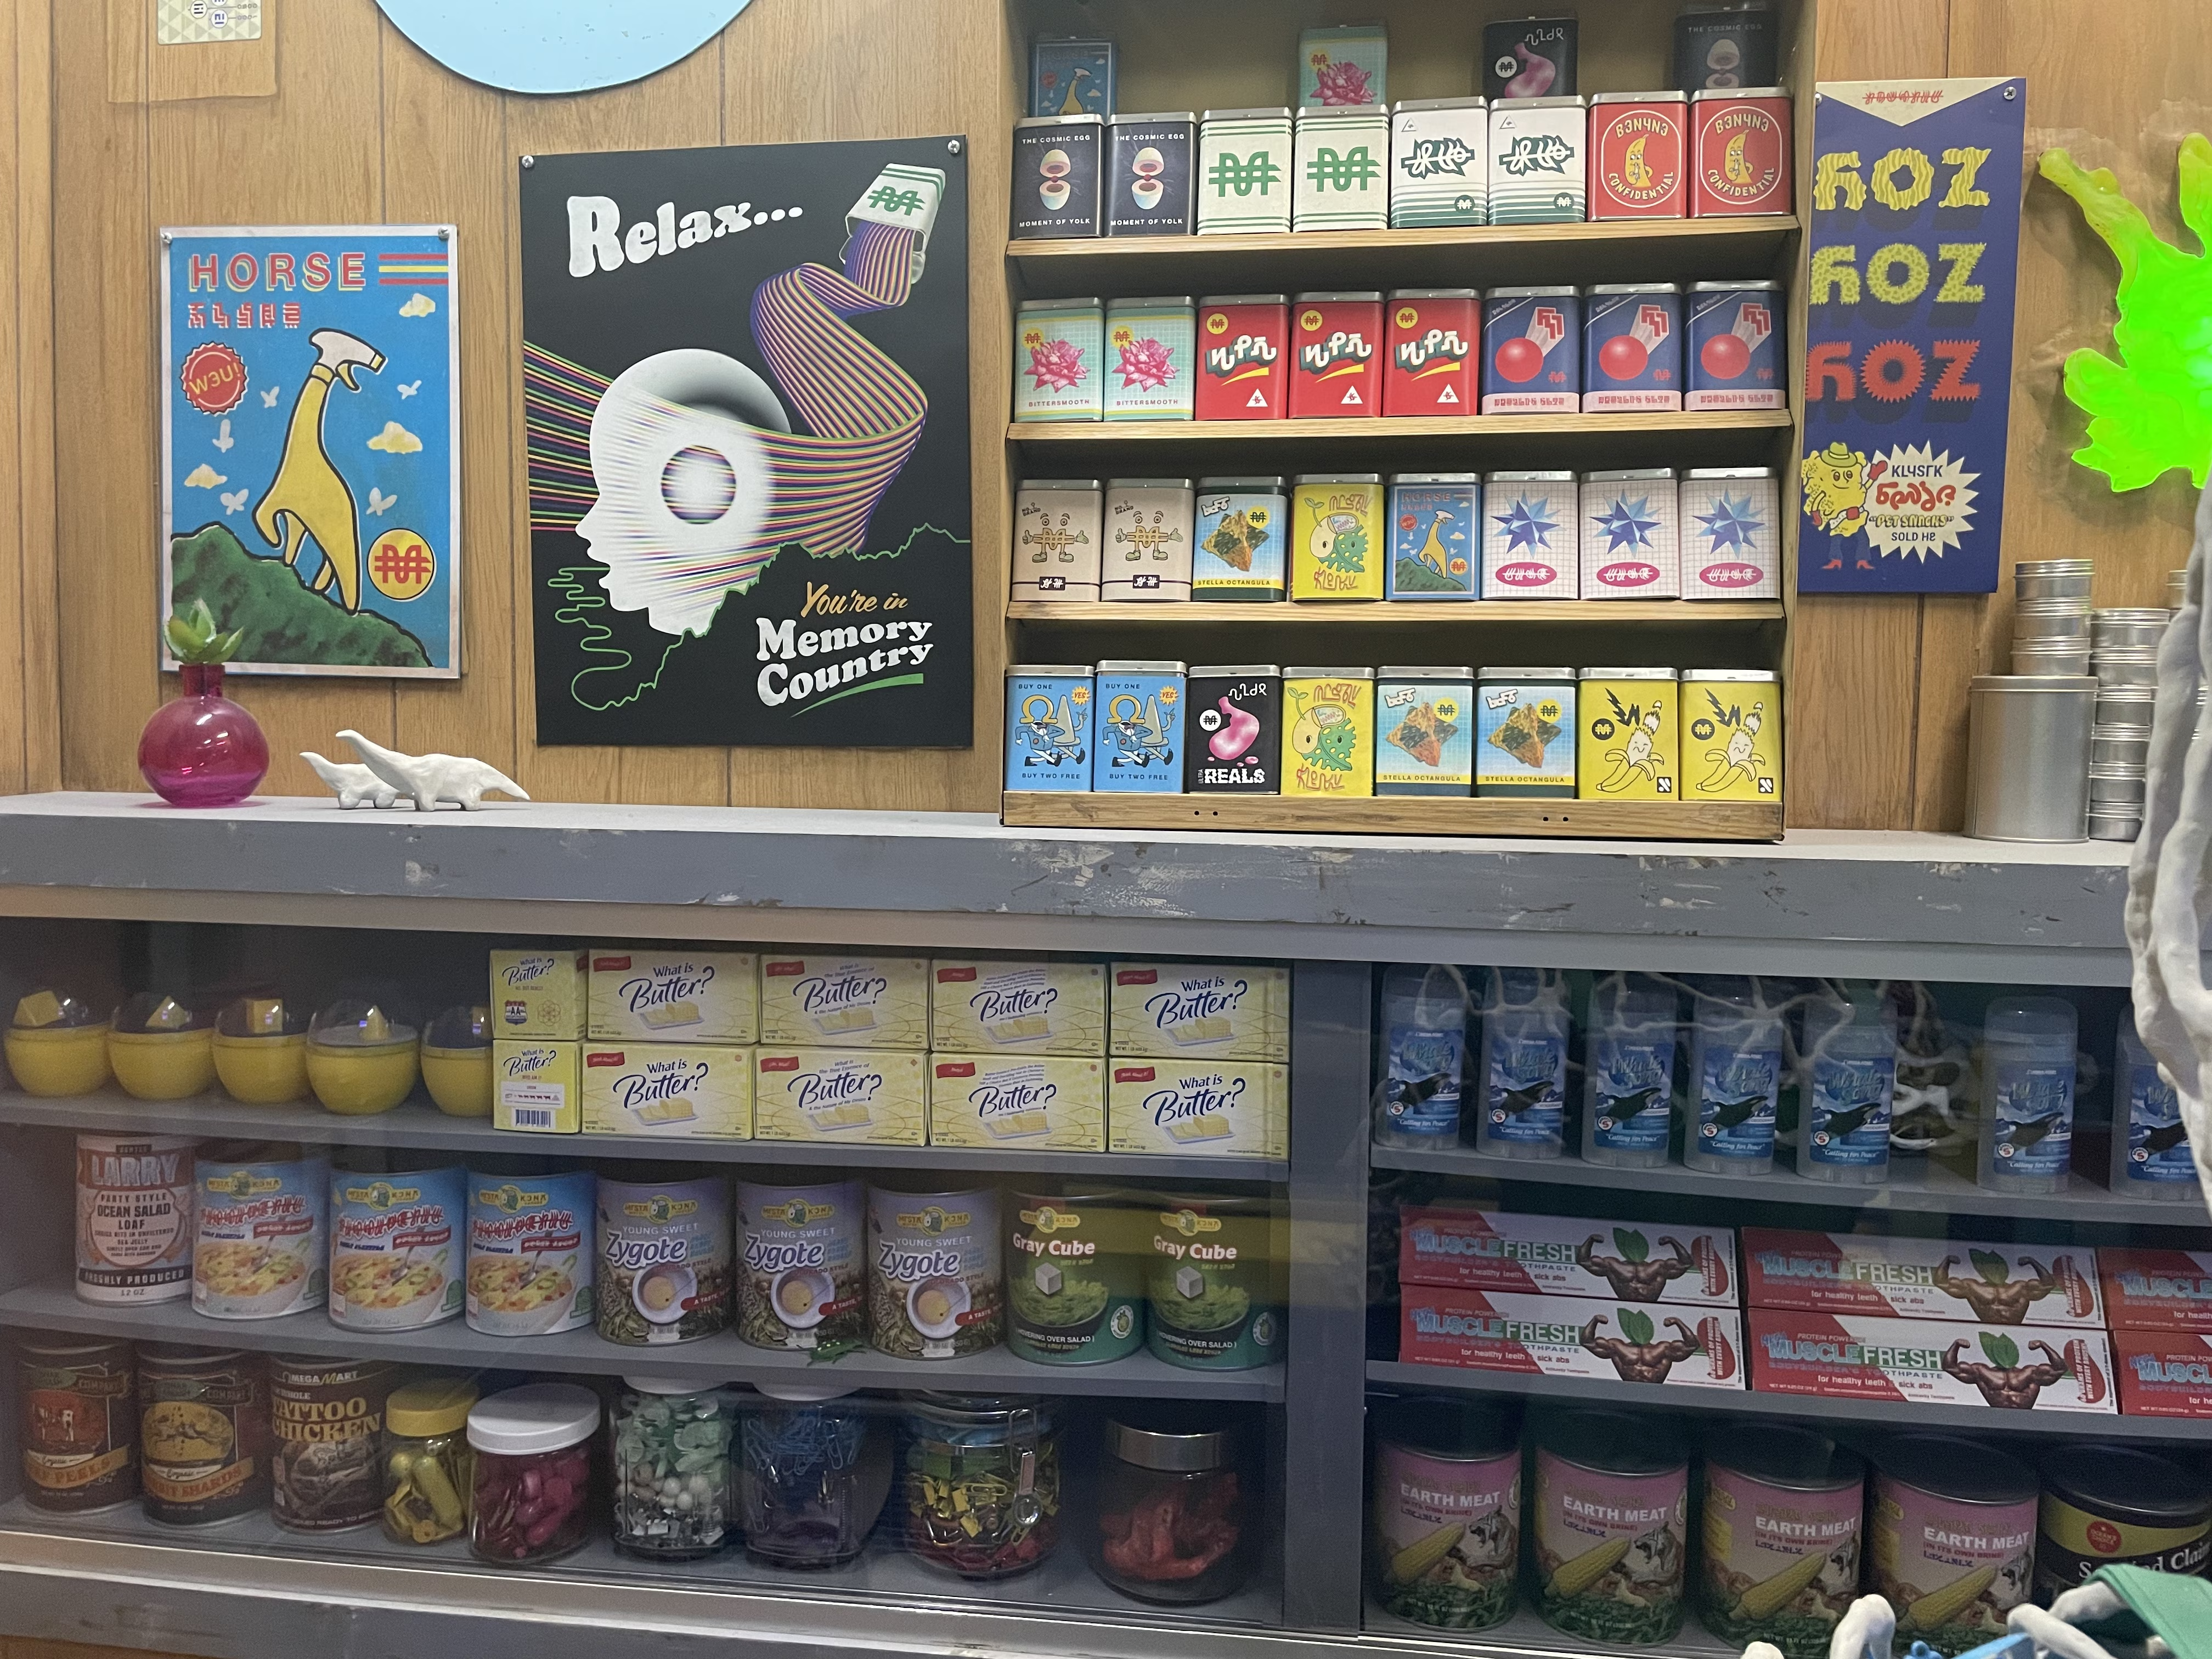
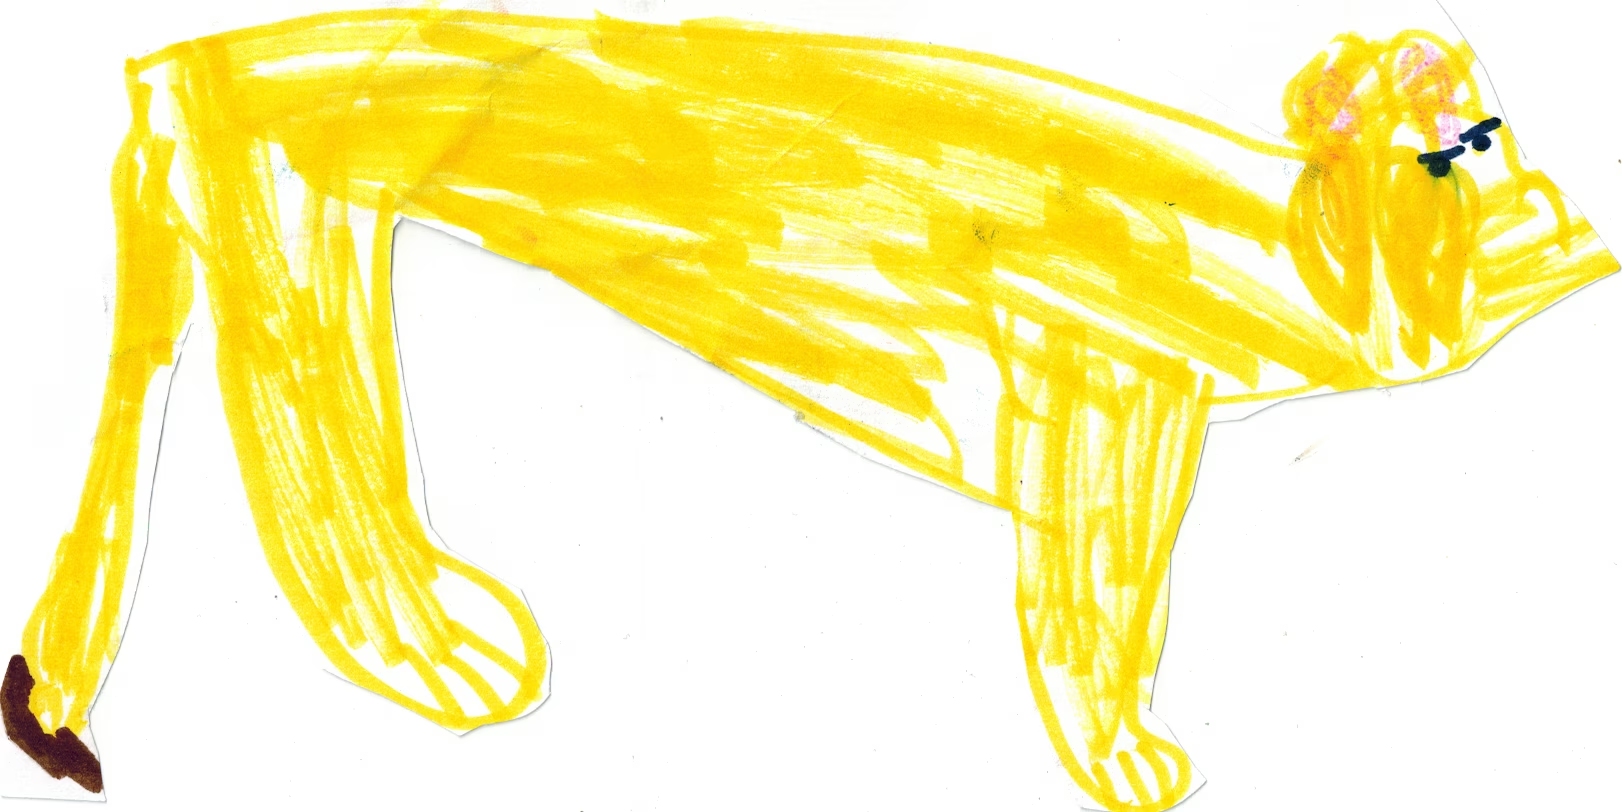
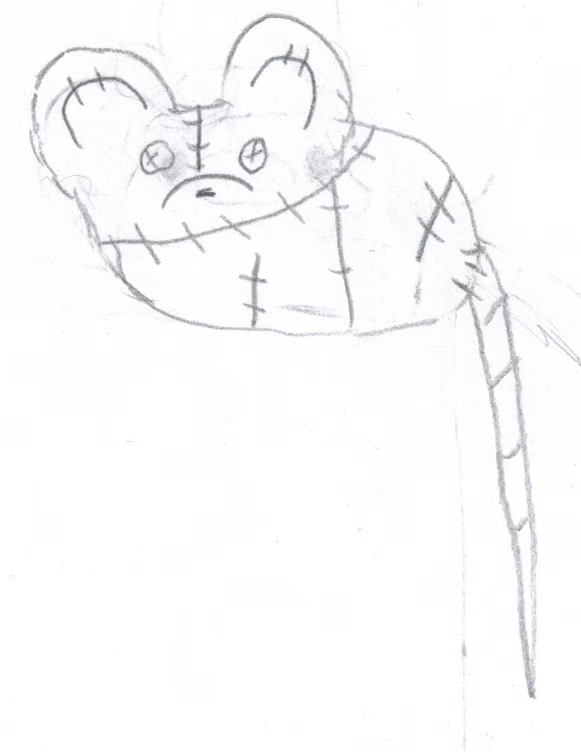
Over the weekend I visited the Denver location of Meow Wolf. Meow Wolf was started in Santa Fe in 2008 and has opened a few other locations since then. Each location has a wide variety of immersive and interactive art. The Denver location is called Convergence Station and is an interdimensional transport hub linking together various different worlds. The different worlds each have their own style and theme that mix facets of Earth with alien. The art is very fractal – there's more levels of detail the closer you look at things. My favorite room is a street scene with Blade Runner-esque vehicles and futuristically weird businesses along the street. There are a few pictures of that below.
It's a very hectic and overwhelming thing to visit. I don't think it was particularly busy when I visited it, but it's not a place for someone who dislikes crowds, noises, or visually busy places. It is not a calm place. But I am not that person, so I found it enjoyable and interesting. If you ever visit a city with a Meow Wolf, I think it's worth checking it out.


 more ...
Beastie Boys - Ill Communication
Coming in hot and debuting at #1, Ill Communication is one of Beastie Boys best albums. On the Wikipedia page, the genres listed are Hip hop, New York Hardcore, Jazz, Funk, and Punk, which shows the breadth of the music on this album.
I've never really been big into Beastie Boys, but sometimes I do like to listen to hip hop and Beastie Boys are definitely among the places I go for that. This album is one that should not be forgotten and deserves to be replayed. Check it out!
more ...Jimmy Buffett – Fruitcakes
Debuting and peaking at #5, Fruitcakes by Jimmy Buffett is not my usual fare.
The title song, Fruitcakes, is basically a middle aged man ranting about his opinions. I'm now a middle aged man and I realize how valuable my opinions are (not very), and I don't need to hear Jimmy's opinions, either. There are a few covers on this album that don't try anything very different from the originals, which I dislike and find pointless. About the nicest thing to say about the songs on his album is that they are definitely by Jimmy Buffett.
Looking at the various streaming music services, only one song from this album (Fruitcakes) cracks Jimmy Buffett's top 40 most-played songs. This album peaked at #5 due to the strength of his past catalog and then quickly fell out of the top ten. This is not a great album and deserves to stay mostly forgotten.
more ...All-4-One – All-4-One
Peaking at #10 the eponymous debut album for the male R&B group represents their zenith of popularity. This band is close enough to a one-hit wonder that the individual members of the band have not been deemed important enough by Wikipedia editors to warrant pages of their own.
The early to mid-90s was a fertile time for boy bands, examples include Boys II Men, NSYNC, and Backstreet Boys. Many of them can trace their success to The New Kids on the Block who were successful in the mid to late-80s.
I have to admit that one of the hits off this album, I Swear, I always though was an NSYNC or Backstreet Boys song. In fact it was originally by none of them and was a John Michael Montgomery country song. The only other song off the album I recall hearing 30ish years ago is So Much in Love which is also a cover. I'm often against covers of songs especially when the cover doesn't bring a new style or perspective to the song. I Swear translated a country song to R&B which makes it somewhat interesting, but the cover So Much in Love is very similar to the original keeping the doo-wop style.
In summary, this album will not be included in my future playlists. I was never into boy bands (*) when they were popular, and 30 years of my changing musical tastes (and they have changed, I swear!) has not broadened enough to include this album.
(*) There are some songs that are exceptions…
more ...The Crow Motion Picture Soundtrack
Coming in at #6 is the soundtrack for the 1994 Film The Crow. The movie is infamous because the star of the film, Brandon Lee (the son of the famous martial artist and actor Bruce Lee), was killed during filming of the movie due to an improperly-prepared prop gun. The movie came out on May 13, 1994, but this album went on sale a few weeks before the movie came out. The release of the film propelled the album to the top of the charts one week from "now."
Combined with the notoriety of the movie, the album likely did well considering the strong suite of artists and songs on the album: The Cure, Stone Temple Pilots, Nine Inch Nails, Rage Against the Machine, Violent Femmes, and Pantera. Looking a few streaming services, a fair number of the songs by these popular artists included in the album are among the top 10 songs played for each.
There are a few weaker songs on this album by less-well known artists, but that's okay, the good songs on this album are very good. I'm not sure I'd play this album as a whole much going forward, but the great songs are definitely worth playing again.
I don't think I've actually seen the movie before, and having done this review I think I will remedy that soon!
more ...Denver Botanic Gardens
Here are a few photos from today's visit to the Denver Botanic Gardens. We visited a few months ago during the winter (on a nice day) and it was nice to see the gardens in full springtime bloom.


 more ...
Reba McEntire - Read My Mind
Read My Mind by Reba McEntire is not the top-ranked album I have yet to listen to. That is actually Chant by the Benedictine Monks of Santo Domingo de Silos. However, I cannot find that album on any of the streaming services I have access to, and I don't care to try any harder than that.
As it goes, it is perhaps too bad that I can't find the Chant album because Read My Mind is boring. I have no feelings one way or another about the album. I guess it's fine, it's not offensive. But it's boring. On the other hand, I suspect that Chant would have at least been different.
more ...Tim McGraw - Not a Moment Too Soon
Not a Moment Too Soon by Tim McGraw is the #3 album this week. I am not a big fan of modern country music. I like older country music: Johnny Cash, Dolly Parton, Willie Nelson are all great. Their songs are original and compelling. I find modern country a bit too trite and repetitive. The songs are so formulaic that someone put together a mix of songs all about the same things:
Not all modern country music is this bad. The worst country music is confined to the Bro-Country sub-genre. To an extent, the purveyors of this music are self-aware about this. For example, Beer Beer, Truck Truck (video) is a direct response to this criticism.
Not a Moment Too Soon is a bit too old to be Bro-Country and commit all the sins highlighted in the video above. Instead, it commits other sins including tackiness and racism!
- In It Doesn't Get Any Countrier Than This McGraw sings to his mother about his girlfriend and all the sex they've been having.
- In Indian Outlaw, McGraw (who is white) sings as if he was a Native American about his wigwam, paw-paw, and maw-maw. During one bridge there's a refrain that sounds like the Atlanta Braves theme.
- Refried Dreams is about being stuck in Mexico, destitute and missing a lost love. I'm not exactly sure what is refried about his dreams. Perhaps they're broken dreams, or unfulfilled, but what's refried about all that? Are they only refried because it sounds like refried beans? If so, is it basically only a slightly-racist pun? Hrm.
- Don't Take the Girl gives me painful whiplash. The first stanza is about a boy who wants to go fishing with his father, but doesn't want a girl to come along. No problem, that's cute enough. The next stanza the same boy is a teenager taking the same girl to the movies, when they are accosted by a stranger with a gun who wants to harm the girl. Wow, that's quite the turn. In the final stanza, the girl is dying during childbirth. Um, okay, that's… a way to end this song. I guess it tells a story but it's not a great one and it's not done in a way I find very artistic.
If you're wondering, in my opinion Americana is the inheritor to classic Country music.
Finally, I will not be listening to this album again.
more ...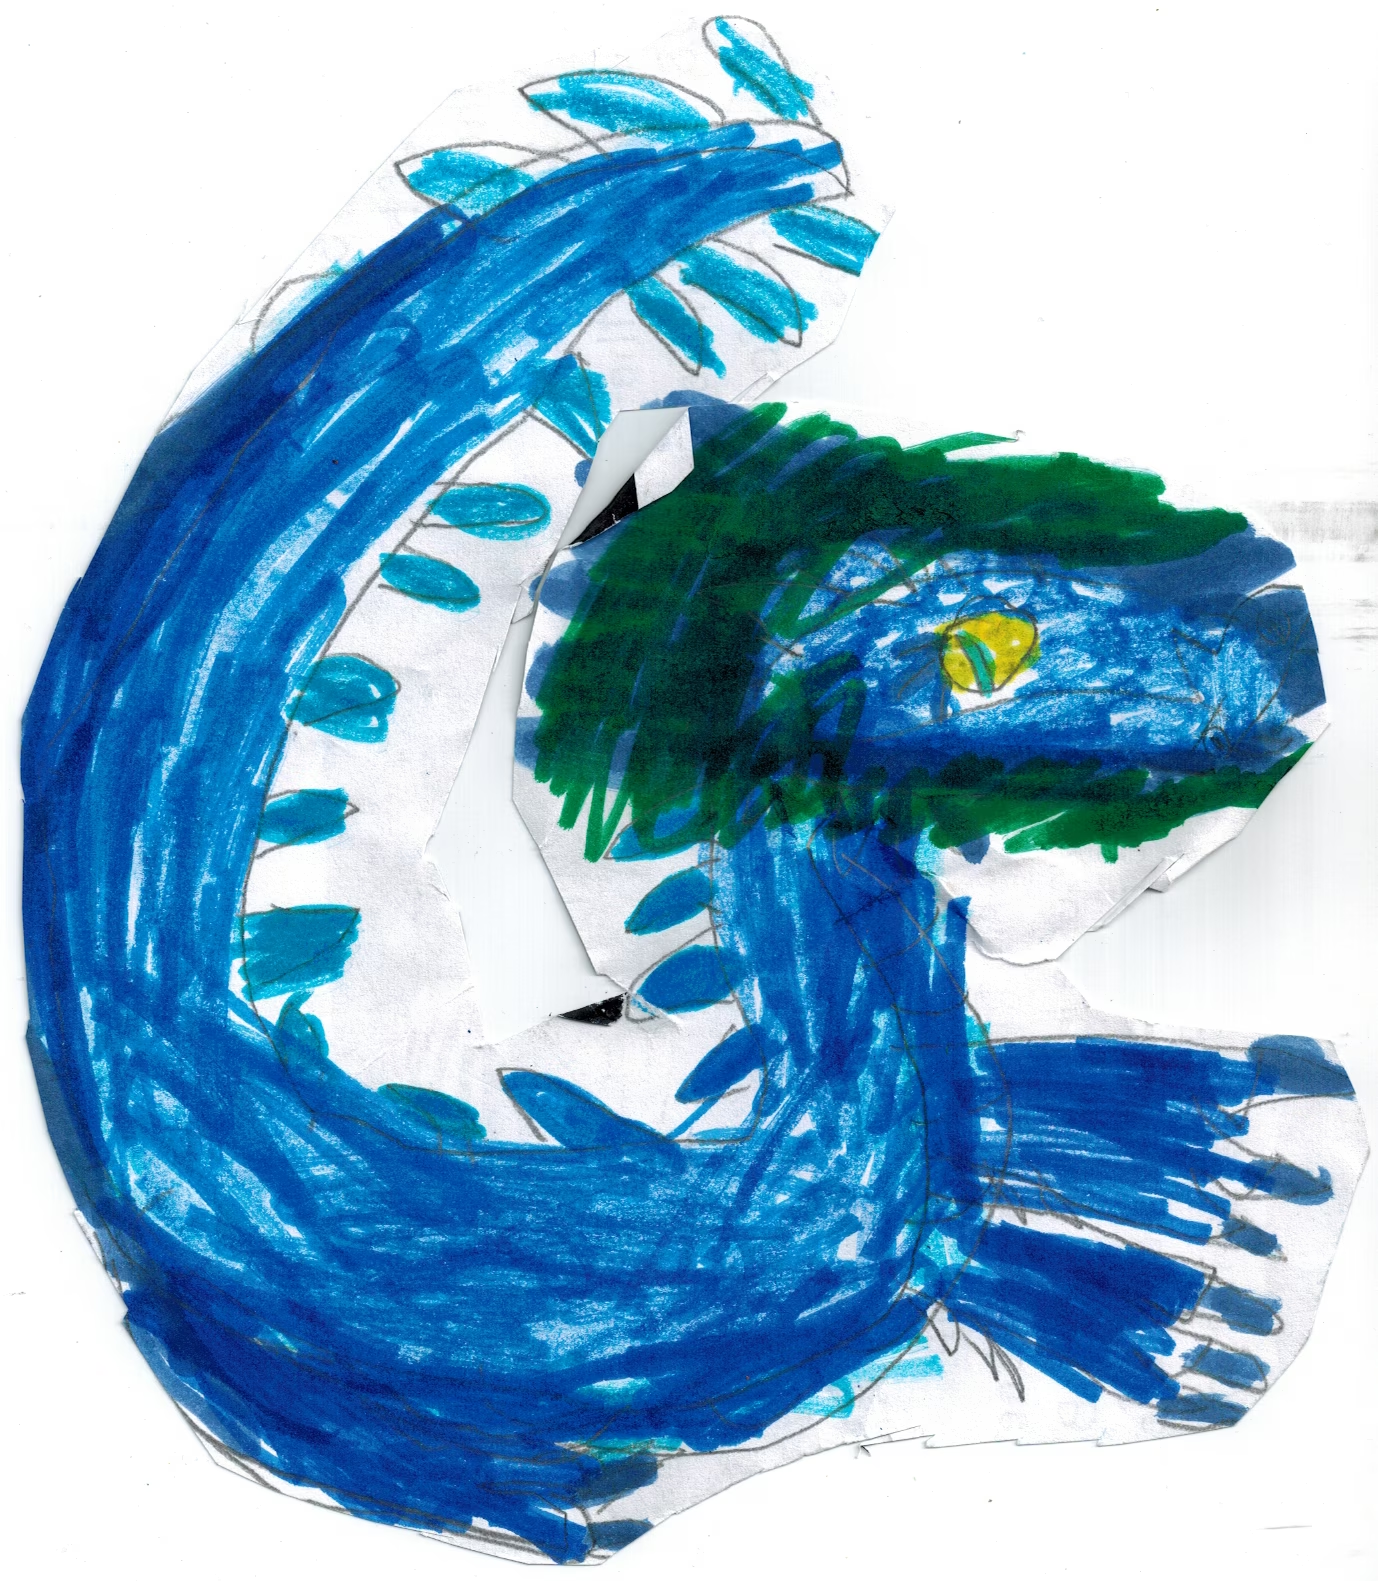


Above The Rim Soundtrack
This week I need to drop down to #3 to pick a new album. This is the soundtrack for the film Above the Rim, a movie I have not viewed. It has a middling rating on Rotten Tomatoes so I probably won't seek it out. It also doesn't seem to be on any streaming service I subscribe to, which makes the effort too much, anyway.
Listening to the album I think there are only a couple reasons why anyone would have bought the album:
- Tupac Shakur starred in the movie and there are three songs on the soundtrack that he presumably made for the film that were not available on any of his albums.
- The only genuine hit off the album is "Regulate" by Warren G. and Nate Dogg. The stand-alone album by Warren G., Regulate... G Funk Era, with the song didn't come out until June 1994, so the only way to buy the song at the time was to buy this album. My memory is a bit fuzzy, but I think I actually purchased a copy of the Warren G. album largely for this song.
All the other songs on this album are forgettable. There's a fairly pointless cover of the Al Green song "I'm Still in Love with You." When I write "pointless," I don't mean it didn't fit into the movie (it may have and I'll never know), I mean that the cover doesn't do anything the original doesn't already do. I'll bet the cover was cheaper to license. All the rest is pretty standard mid-90s hip-hop – songs where the artist states their name and the label they're signed to, etc. Granted, for a movie soundtrack, it's probably okay having some more generic music so it doesn't distract from what's happening on screen or with any dialog.
My final words are that this album can be left to the dusty piles of history. If you want to listen to "Regulate," listen to Warren G.'s album. If you want to listen to Tupac, listen to his multiple acclaimed albums which have better songs than what he made for the film.
more ...Pink Floyd - The Division Bell
Finding this album at #1 is both suprising and unsurprising. Pink Floyd was (is?) the greatest Prog Rock band of all time. Prog Rock reached peak popularity in the 70s, but by 1994 it was being supplanted by newer forms of Rock like Metal (Pantera) or Grunge (Soundgarden). The fact that The Division Bell was able to reach #1 is a testament to the greatness and popularity of Pink Floyd.
Among the Pink Floyd albums, this one definitely ranks behind their best, like Dark Side of the Moon, Wish You Were Here, and their double album The Wall. The track Comfortably Numb off of The Wall has two of the greatest guitar solos of all time in the same song. I've listened to this album two or three times and I can't think of any guitar solo that caught my attention. There are guitar solos, yes, but they don't have the same emotion.
I think that's the main problem with this album, it feels a bit too procedural. Pink Floyd had been popular for a couple decades by the mid-90s, and frankly, they were no longer starving musicians. Being a bit desperate and unloved can help a musician make great music. It is not bad music. Pink Floyd didn't suddenly forget how to make music, but there's nothing in this album that sparks emotion.
Not all albums an artist or group makes are going to be great. I'll still listen to Pink Floyd's great albums, but this one will probably get very few spins from me going forward.
more ...